Use case 1: surveying collaboration in a company
This use case shows in full how a network survey in a company is run with MyNetworkmap: from the research question through the online questionnaire to the interpretation of the measures.
The example: Helios Medizintechnik GmbH has 22 employees in five departments. Management observes that development projects fail late because sales passes customer requirements on too slowly. A working group on organisational development is to find out how collaboration actually runs – beyond the organisation chart.
A note on the data: the questionnaire, the screenshots and the procedure in this chapter come from a real installation. The data set that is analysed was prepared for this manual so that the interpretation shows traceable, reproducible figures. All measures quoted are the values MyNetworkmap computed for that data set.
Part 1: theoretical background
Why the organisation chart is not enough
An organisation chart shows who reports to whom. It says nothing about who actually asks whom when a problem comes up. The two structures regularly come apart – and the second explains working life better.
Organisational network analysis (ONA) makes that second structure visible. It distinguishes three kinds of relation that exist side by side in an organisation:
| Kind of relation | Typical question | What it shows |
|---|---|---|
| Instrumental | “Whom do you exchange professional information with?” | How knowledge and work actually flow |
| Expressive | “Whom are you friends with?” | Trust, cohesion, informal bonds |
| Negative | “Where is there friction?” | Blockages, lines of conflict |
This survey concentrates on the instrumental relation: regular professional exchange. That is the kind with the clearest link to work performance and at the same time the one that can be asked about most innocuously.
The three concepts at issue
Silos. A department is densely connected internally and hardly at all outwards. That is not bad in itself – specialisation needs internal density. It becomes a problem when two departments that depend on one another have no direct connection.
Brokers. People who mediate between otherwise separate groups. Ronald Burt calls the gap between two unconnected groups a structural hole; whoever bridges it learns things earlier and can translate them. Brokers are the most valuable and at the same time most vulnerable nodes in an organisation: if a broker drops out, the connection falls apart.
Key people versus managers. Those who are central in a network analysis are rarely at the top of the organisation chart. Often they hold cross-cutting functions – quality assurance, assistance, administration – where many threads come together.
What such a survey requires
Network data is personal data, and it cannot be anonymised: a network question only works if names are named. Three obligations follow:
- Voluntariness and transparency. Purpose, analysis and whereabouts of the data come before the first question.
- No individual-level reporting outwards. What is reported is the structure, not the behaviour of individuals. “Departments X and Y have no direct contact” is admissible; “Ms Z is named by nobody” is not.
- Involving the staff representation. In Germany an employee survey is subject to co-determination.
The response rate matters more in network surveys than in ordinary ones. If one person is missing, it is not only their answers that are missing but every connection only they could have named. Below 70 per cent response, interpreting centrality measures becomes questionable. What that means concretely is shown in the interpretation below.
Part 2: preparing the survey
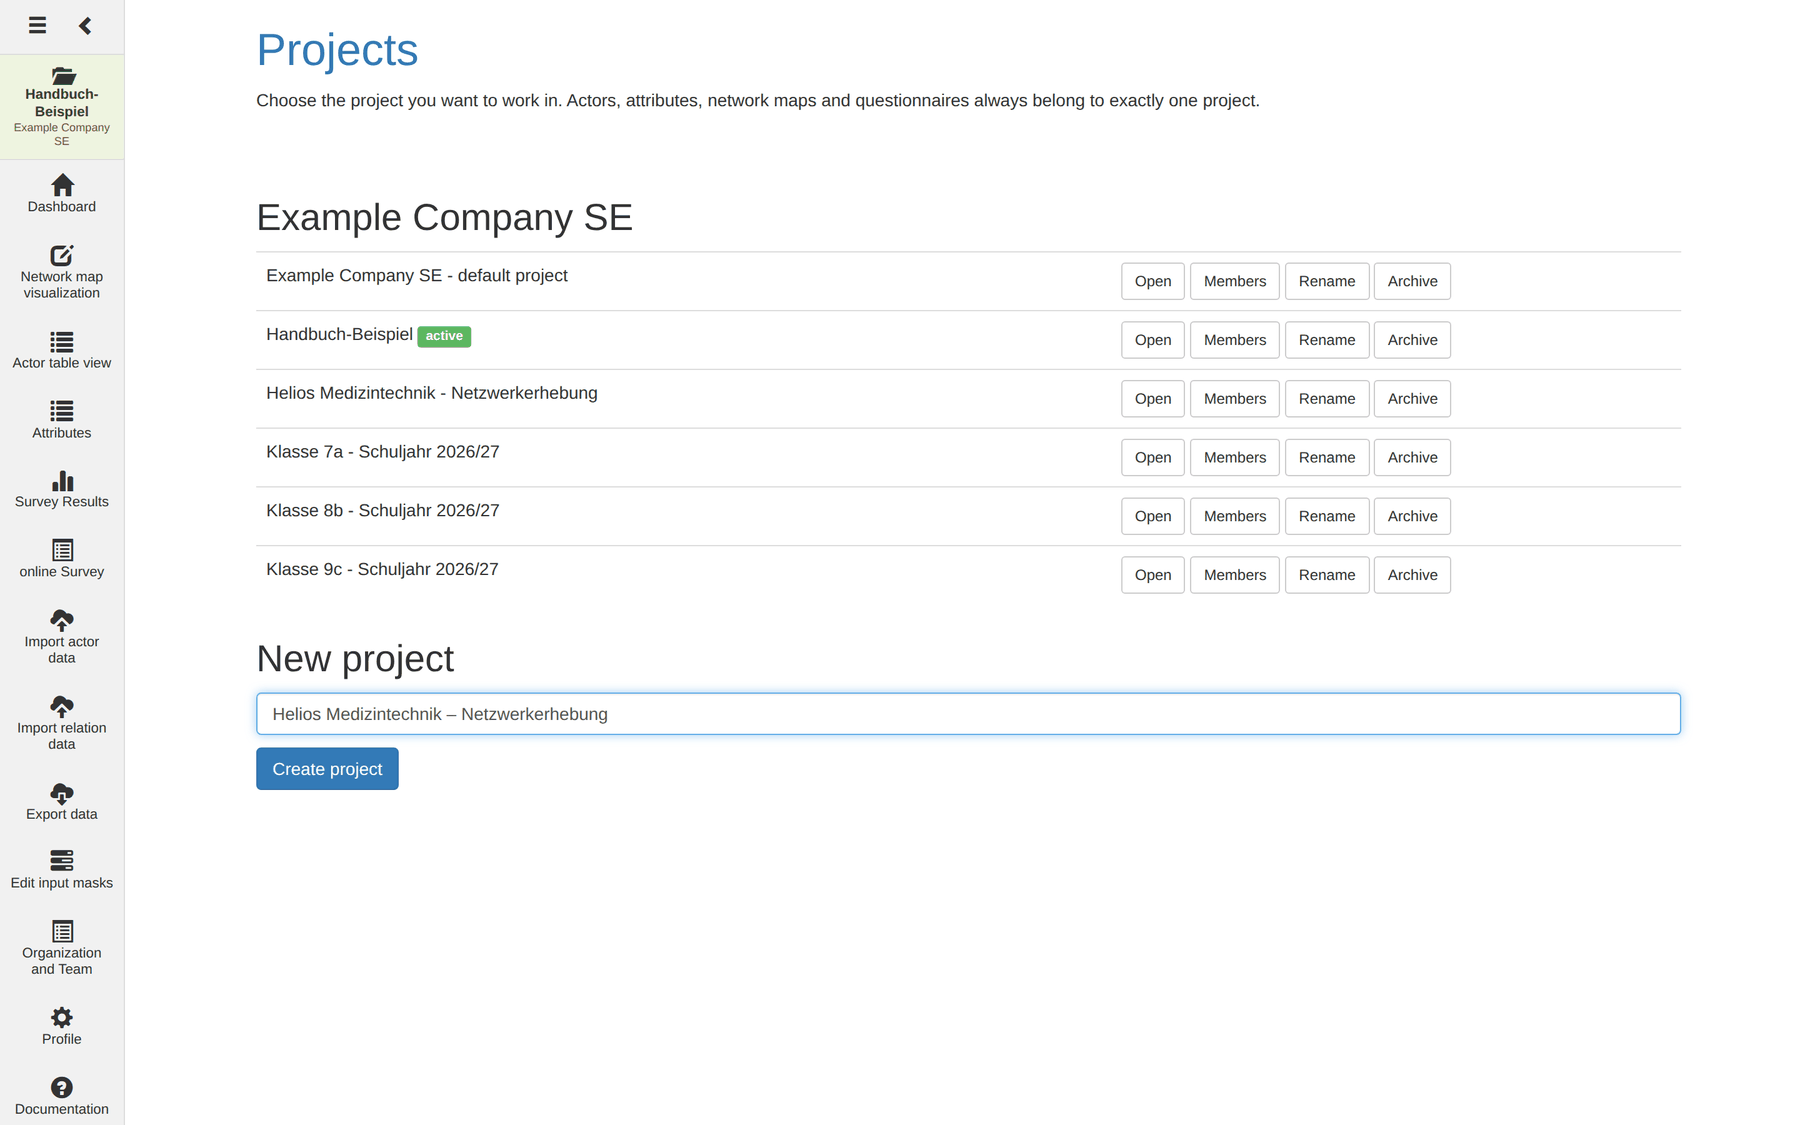
Step 1: create the project
Projects → New project → enter a name, here
Helios Medizintechnik – Netzwerkerhebung → Create project.
Step 2: define the attributes
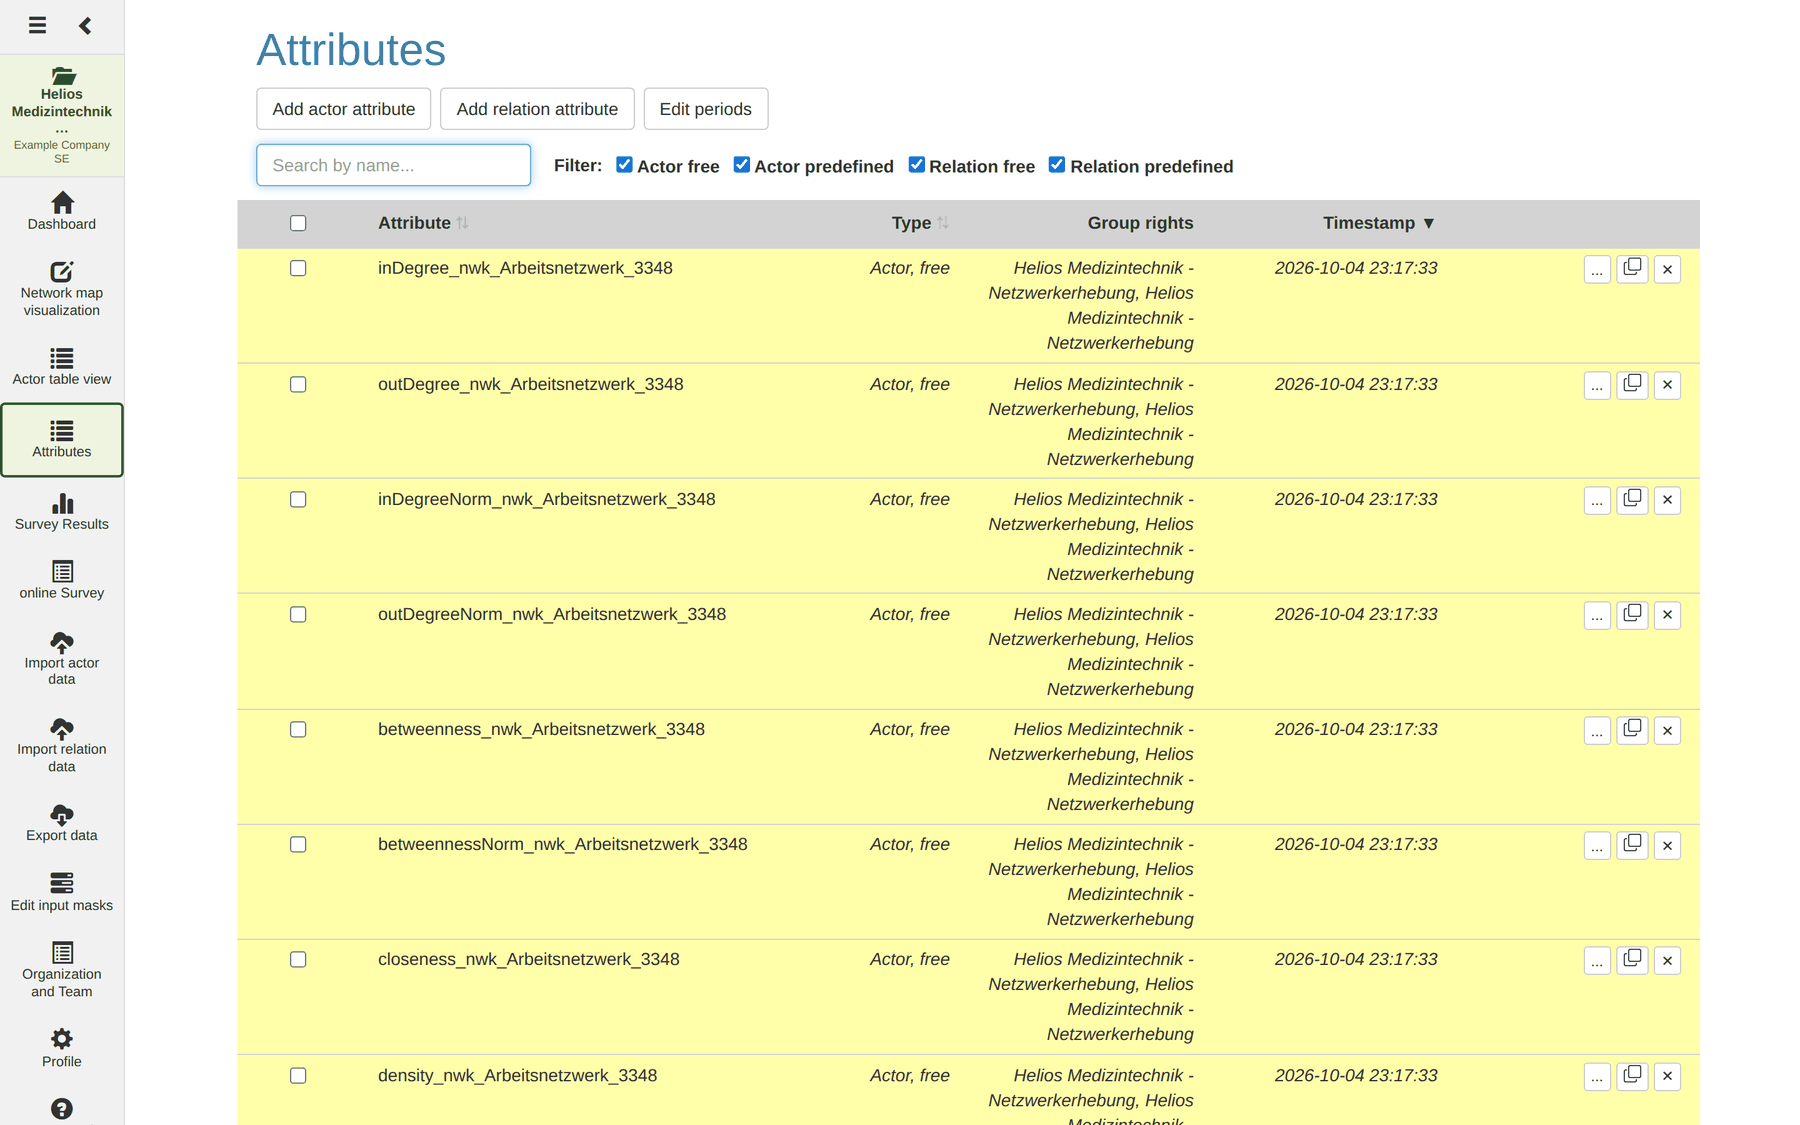
In the Attributes module you create what you want to know about people and about relations.
Actor attributes (through Add actor attribute):
| Attribute | Type | Values |
|---|---|---|
Geschlecht (gender) |
predefined | weiblich, männlich, divers |
Alter (age) |
free text | – |
Wohnort (place) |
free text | – |
Abteilung (department) |
predefined | Entwicklung, Produktion, Vertrieb, Qualitätssicherung, Verwaltung |
Relation attribute (through Add relation attribute):
| Attribute | Type | Values |
|---|---|---|
Arbeitskontakt (work contact) |
predefined | täglich, wöchentlich, monatlich |
Why
Abteilunghas to be predefined: only predefined values can be coloured on the map – and that is exactly what we need later to make silos visible. As free text the department would be worthless for visualisation.
Step 3: create the workforce as actors
Because the group is known and bounded, this is a whole-network study with a roster. For that, all 22 employees must exist as actors beforehand.
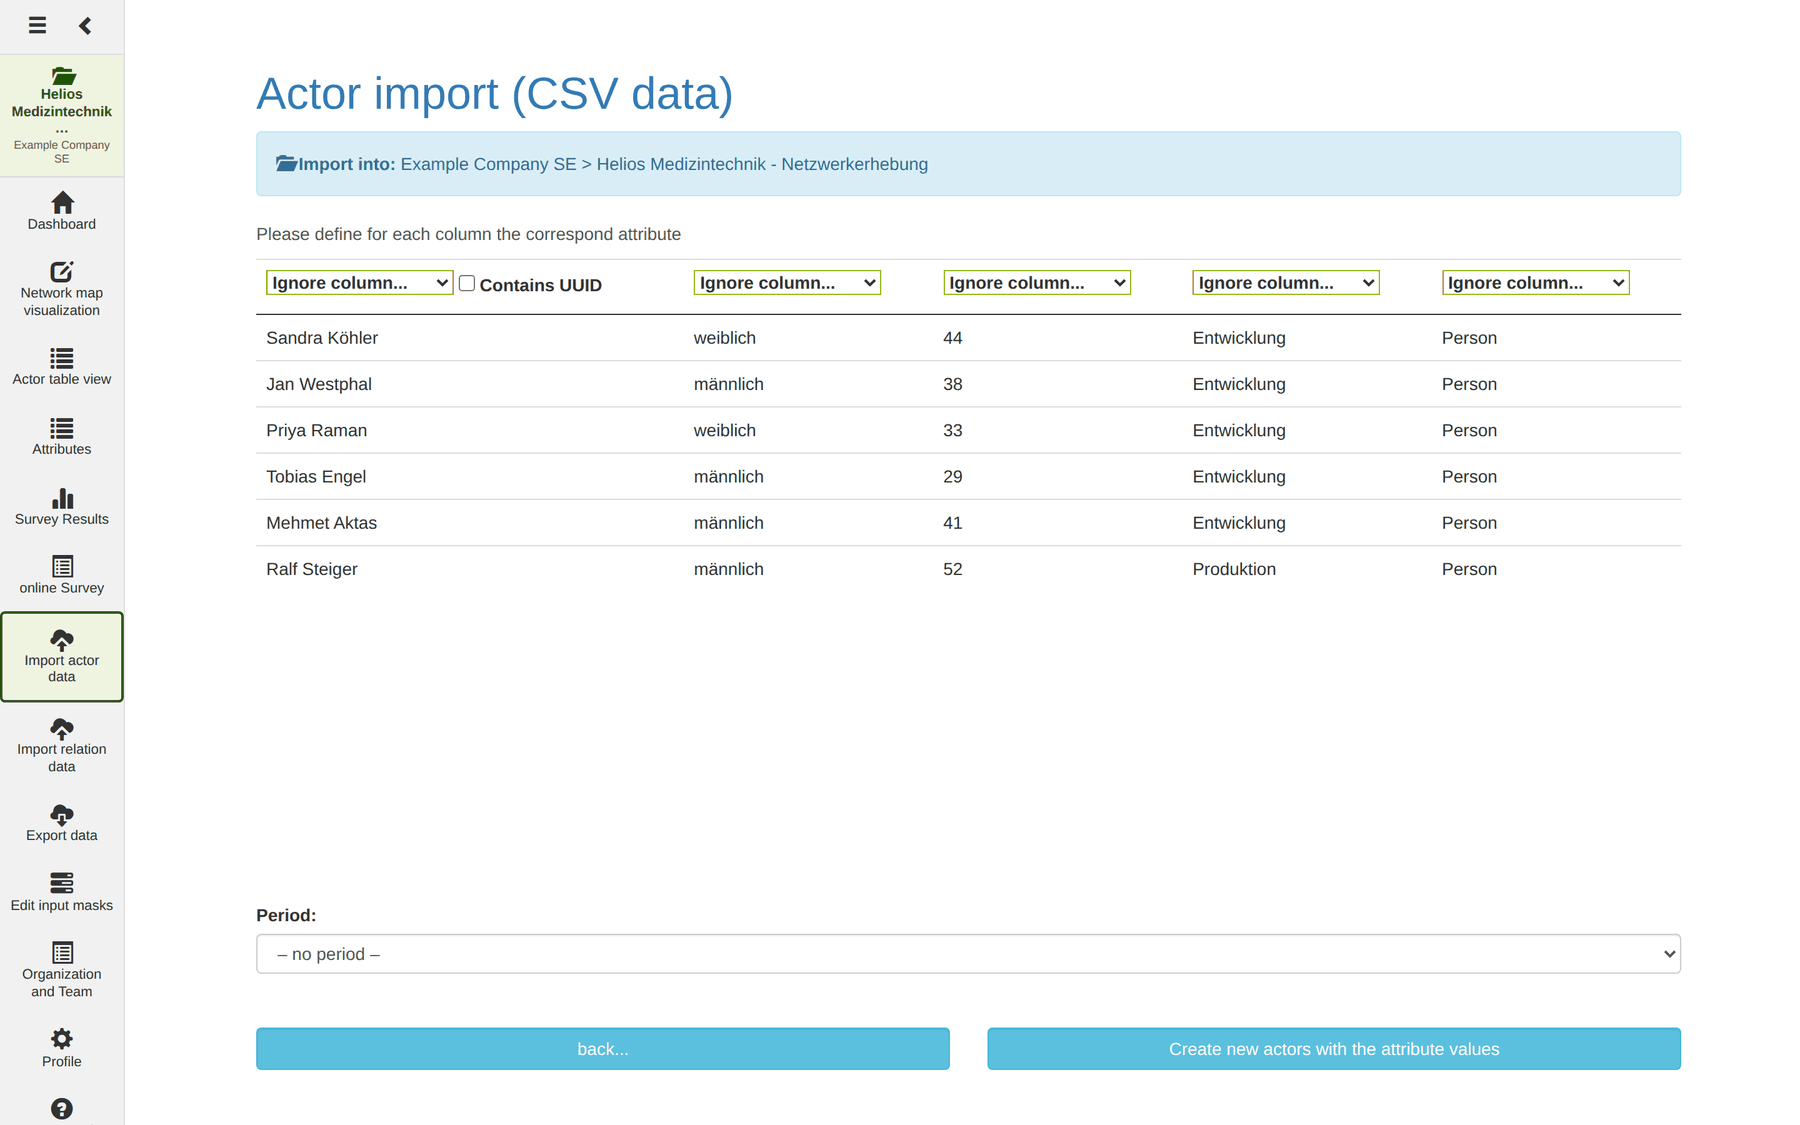
The quickest route is the CSV import. One row per person:
Name;Geschlecht;Alter;Abteilung;type
Sandra Köhler;weiblich;44;Entwicklung;Person
Jan Westphal;männlich;38;Entwicklung;Person
Priya Raman;weiblich;33;Entwicklung;Person
…
The
typecolumn is not decoration. It fills thetypeattribute that MyNetworkmap supplies with the valuePerson. That is precisely what the name list in the questionnaire filters on later – without this column the list stays empty.
Step 4: check the proxy user
For employees without a MyNetworkmap account to be able to answer, a proxy user must be set in Organisation and team. Without it, every participation link reports No interview found.
Part 3: building the questionnaire
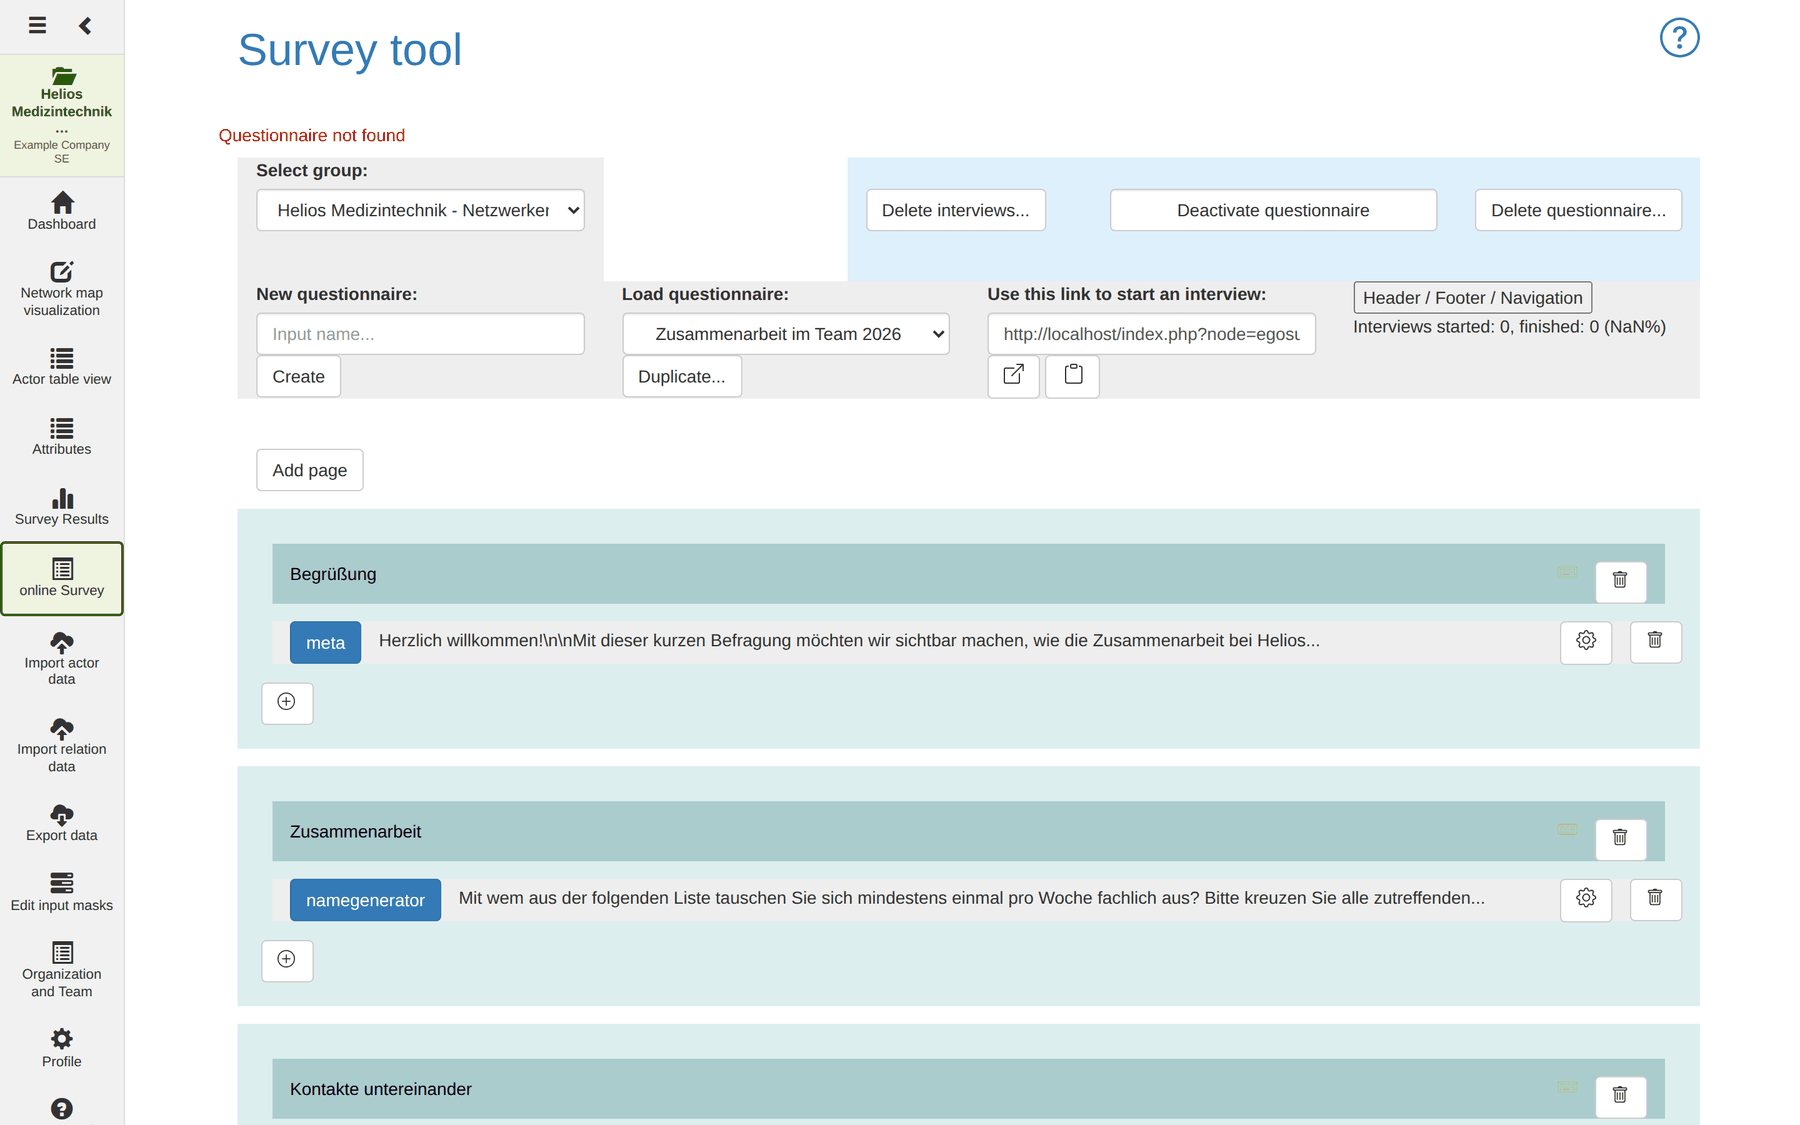
Step 5: create the questionnaire
Online questionnaire → enter the name under New
questionnaire, here Zusammenarbeit im Team 2026 → Create.
Then set title, header, footer and the labels of the paging buttons through Header / Footer / Navigation.
Step 6: page 1 – welcome
Add page → rename the page to Begrüßung → ⊕ → element type
Display a text.
The introduction goes into the Input your text… field. It has to do four things: explain the purpose, assure voluntariness, state the duration, and name the analysis and a contact.
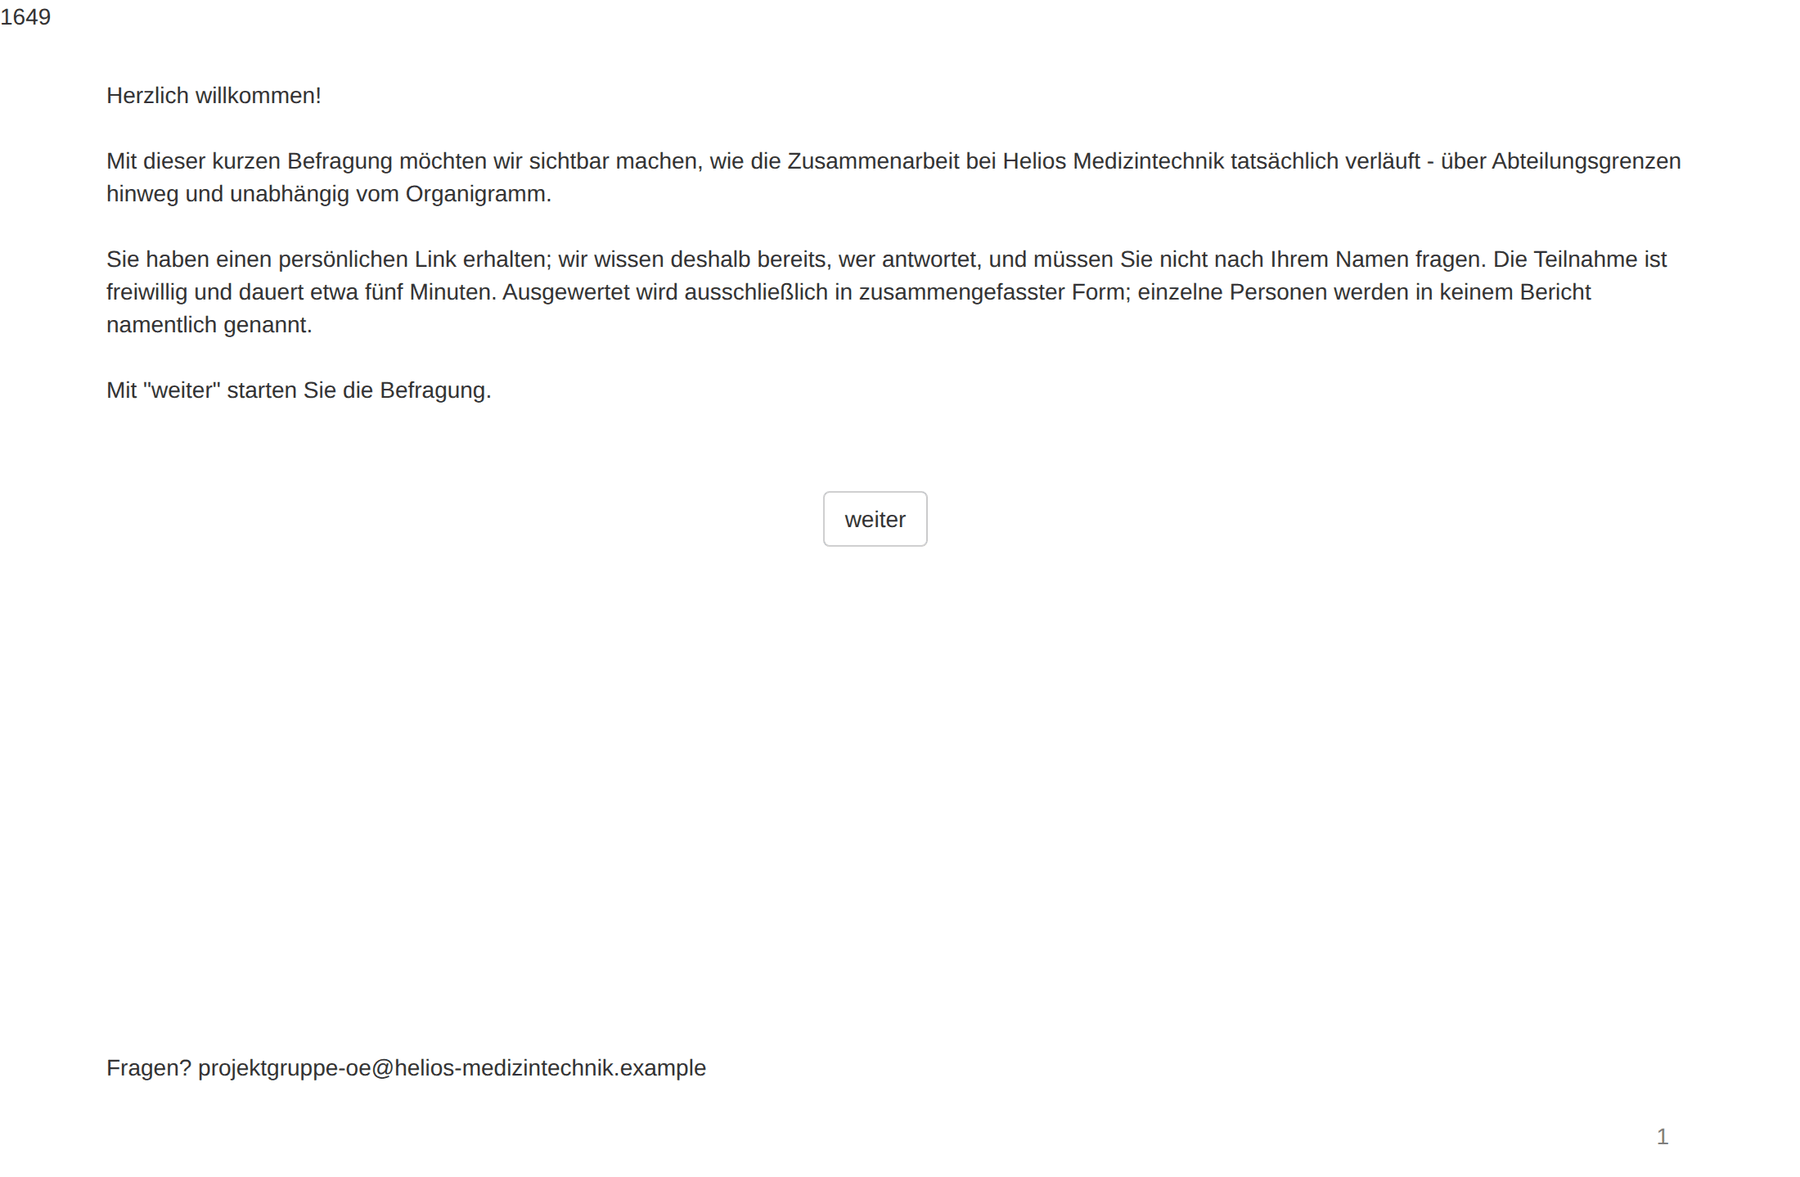
About the screenshots of the interview: the example questionnaire was written in German, because the example organisation is German. What participants read is entirely what the author writes – question texts, button labels, header and footer. The English wordings quoted in this chapter are translations of those German originals.
Step 7: page 2 – the name generator
Add page → Zusammenarbeit → ⊕ → element type
Namegenerator: Predefined name list by actor attribute filter.
| Setting | Value | Why |
|---|---|---|
| Question text | “Which of the people below do you exchange professional information with at least once a week?” | A concrete frequency instead of “often” |
| Name attribute | Name |
Where the names come from |
| Relation attribute | Arbeitskontakt |
Where the answers are written |
| Attribute value | wöchentlich |
Which value is set |
| Filter attribute | type |
Who appears in the list |
| Filter value | Person |
People only, no organisations |
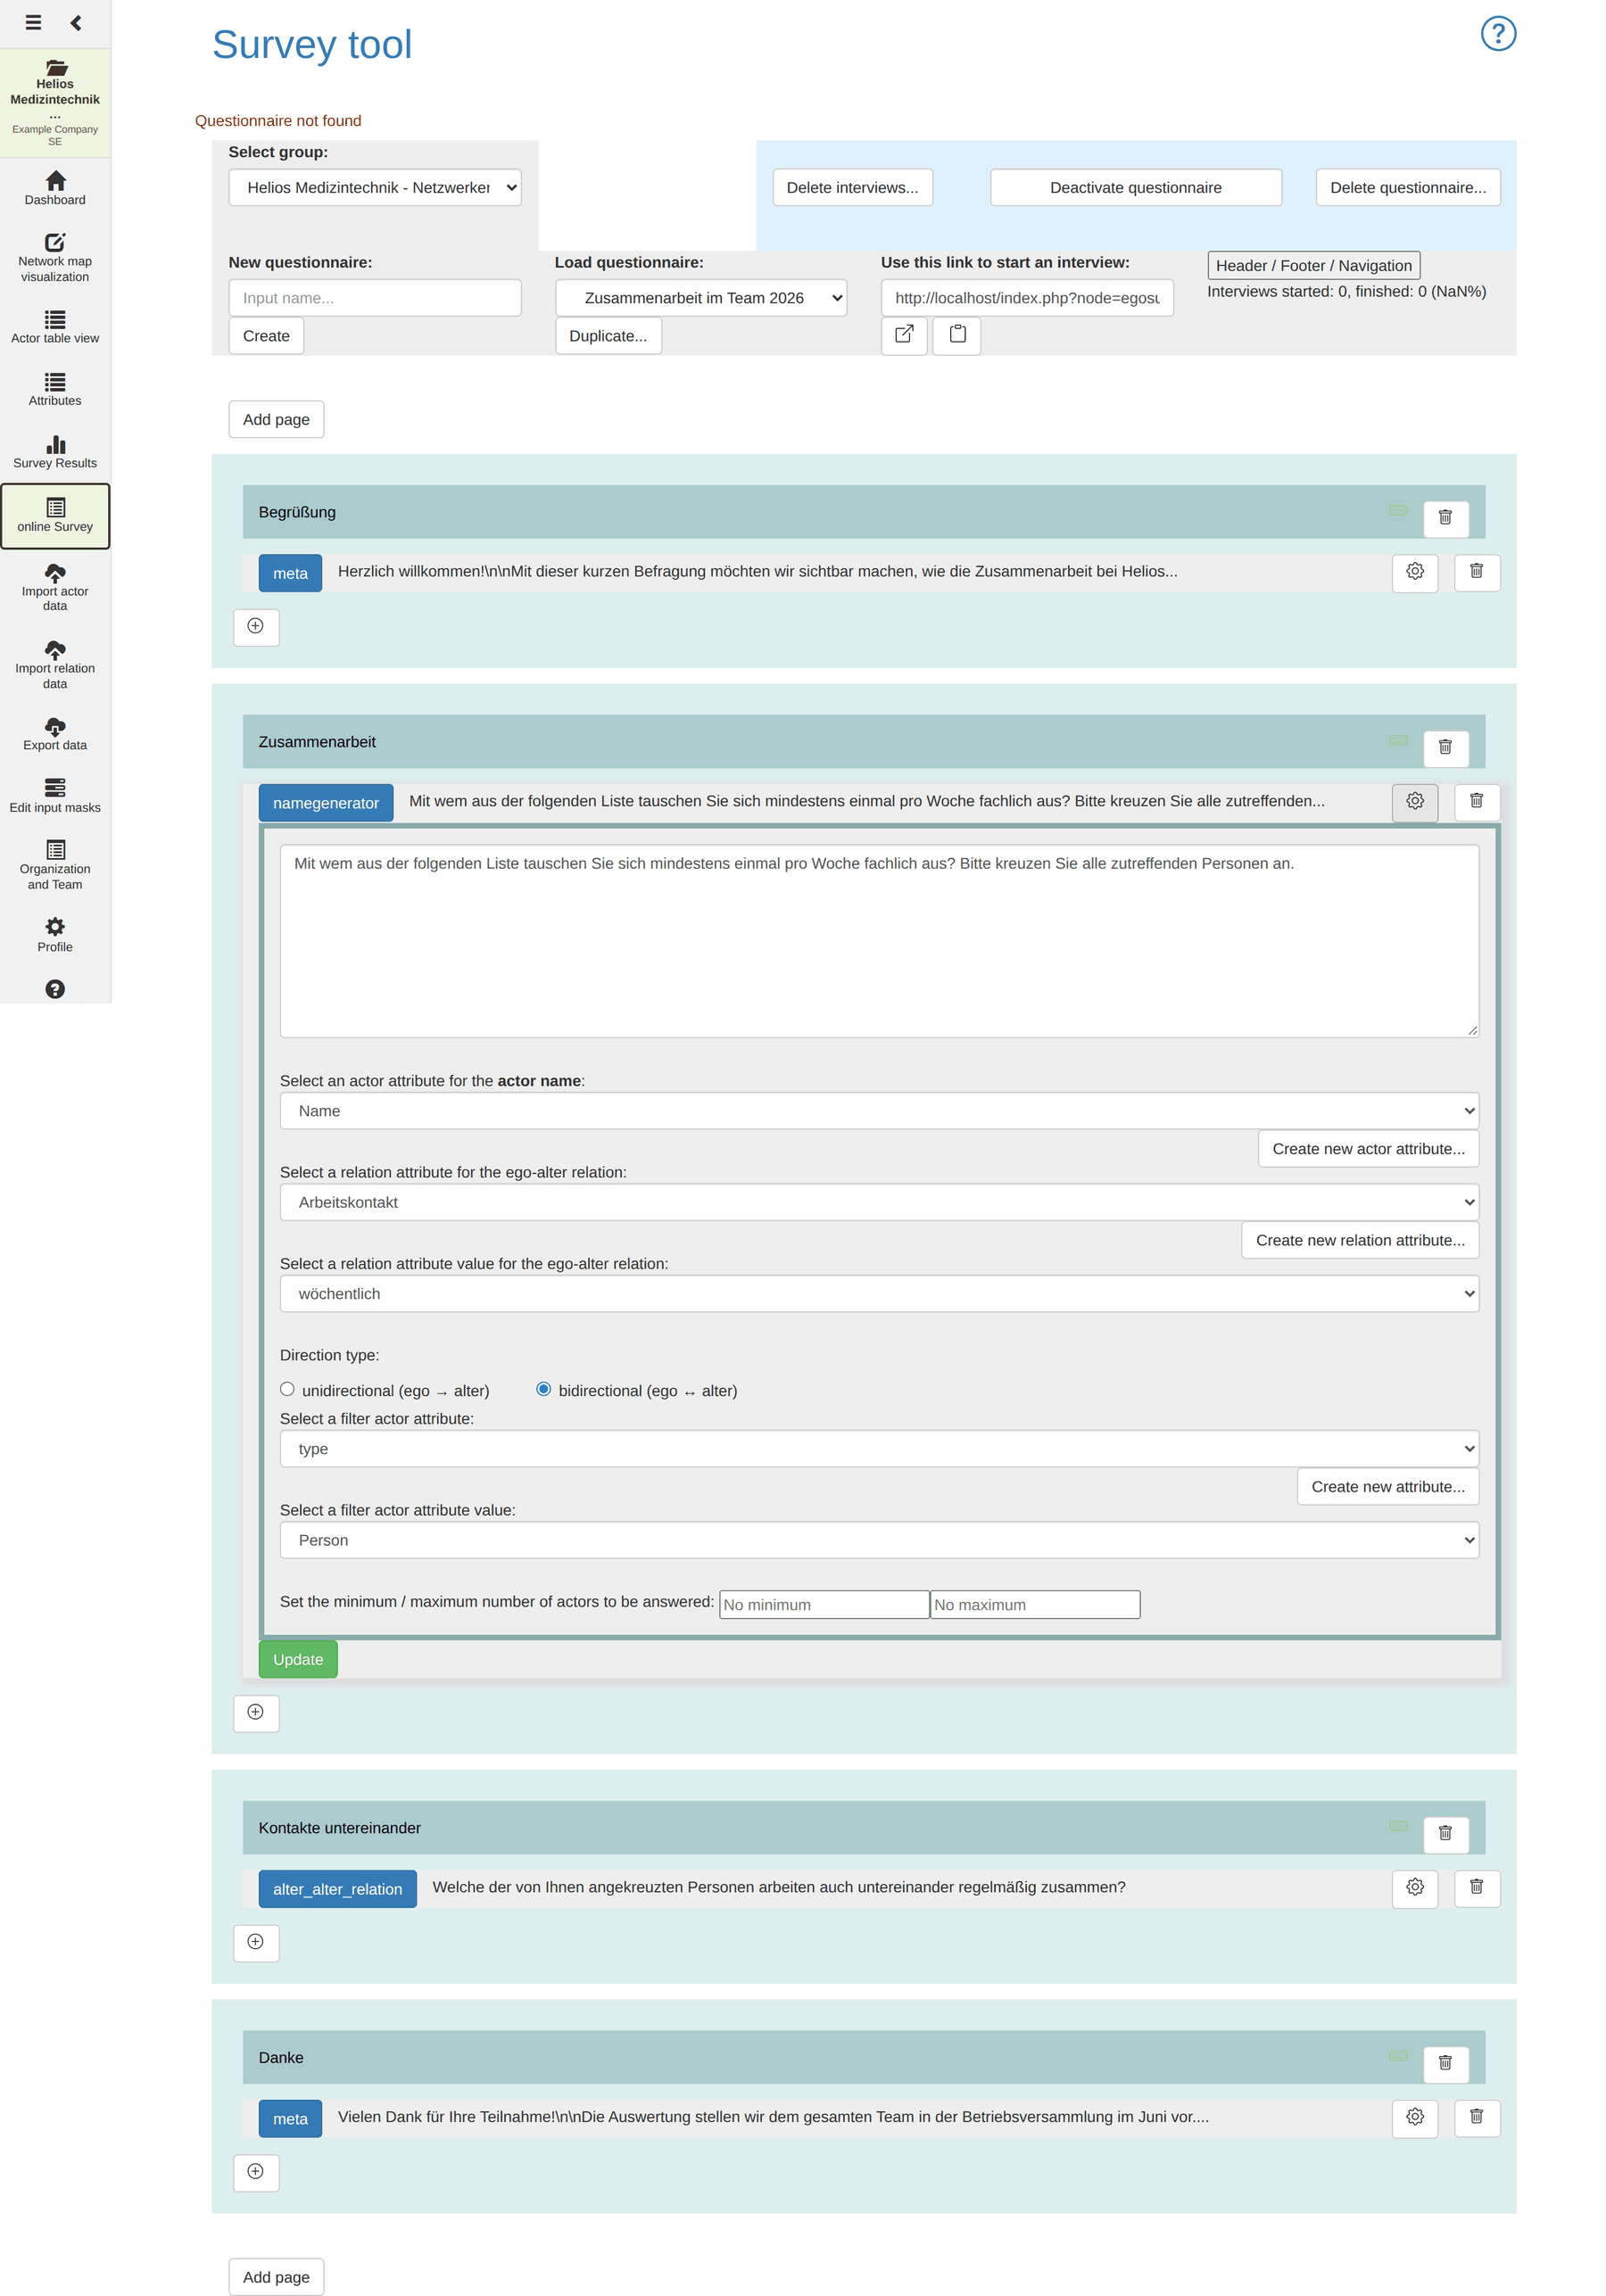
In the interview, respondents see the whole workforce as a clickable list – without themselves.
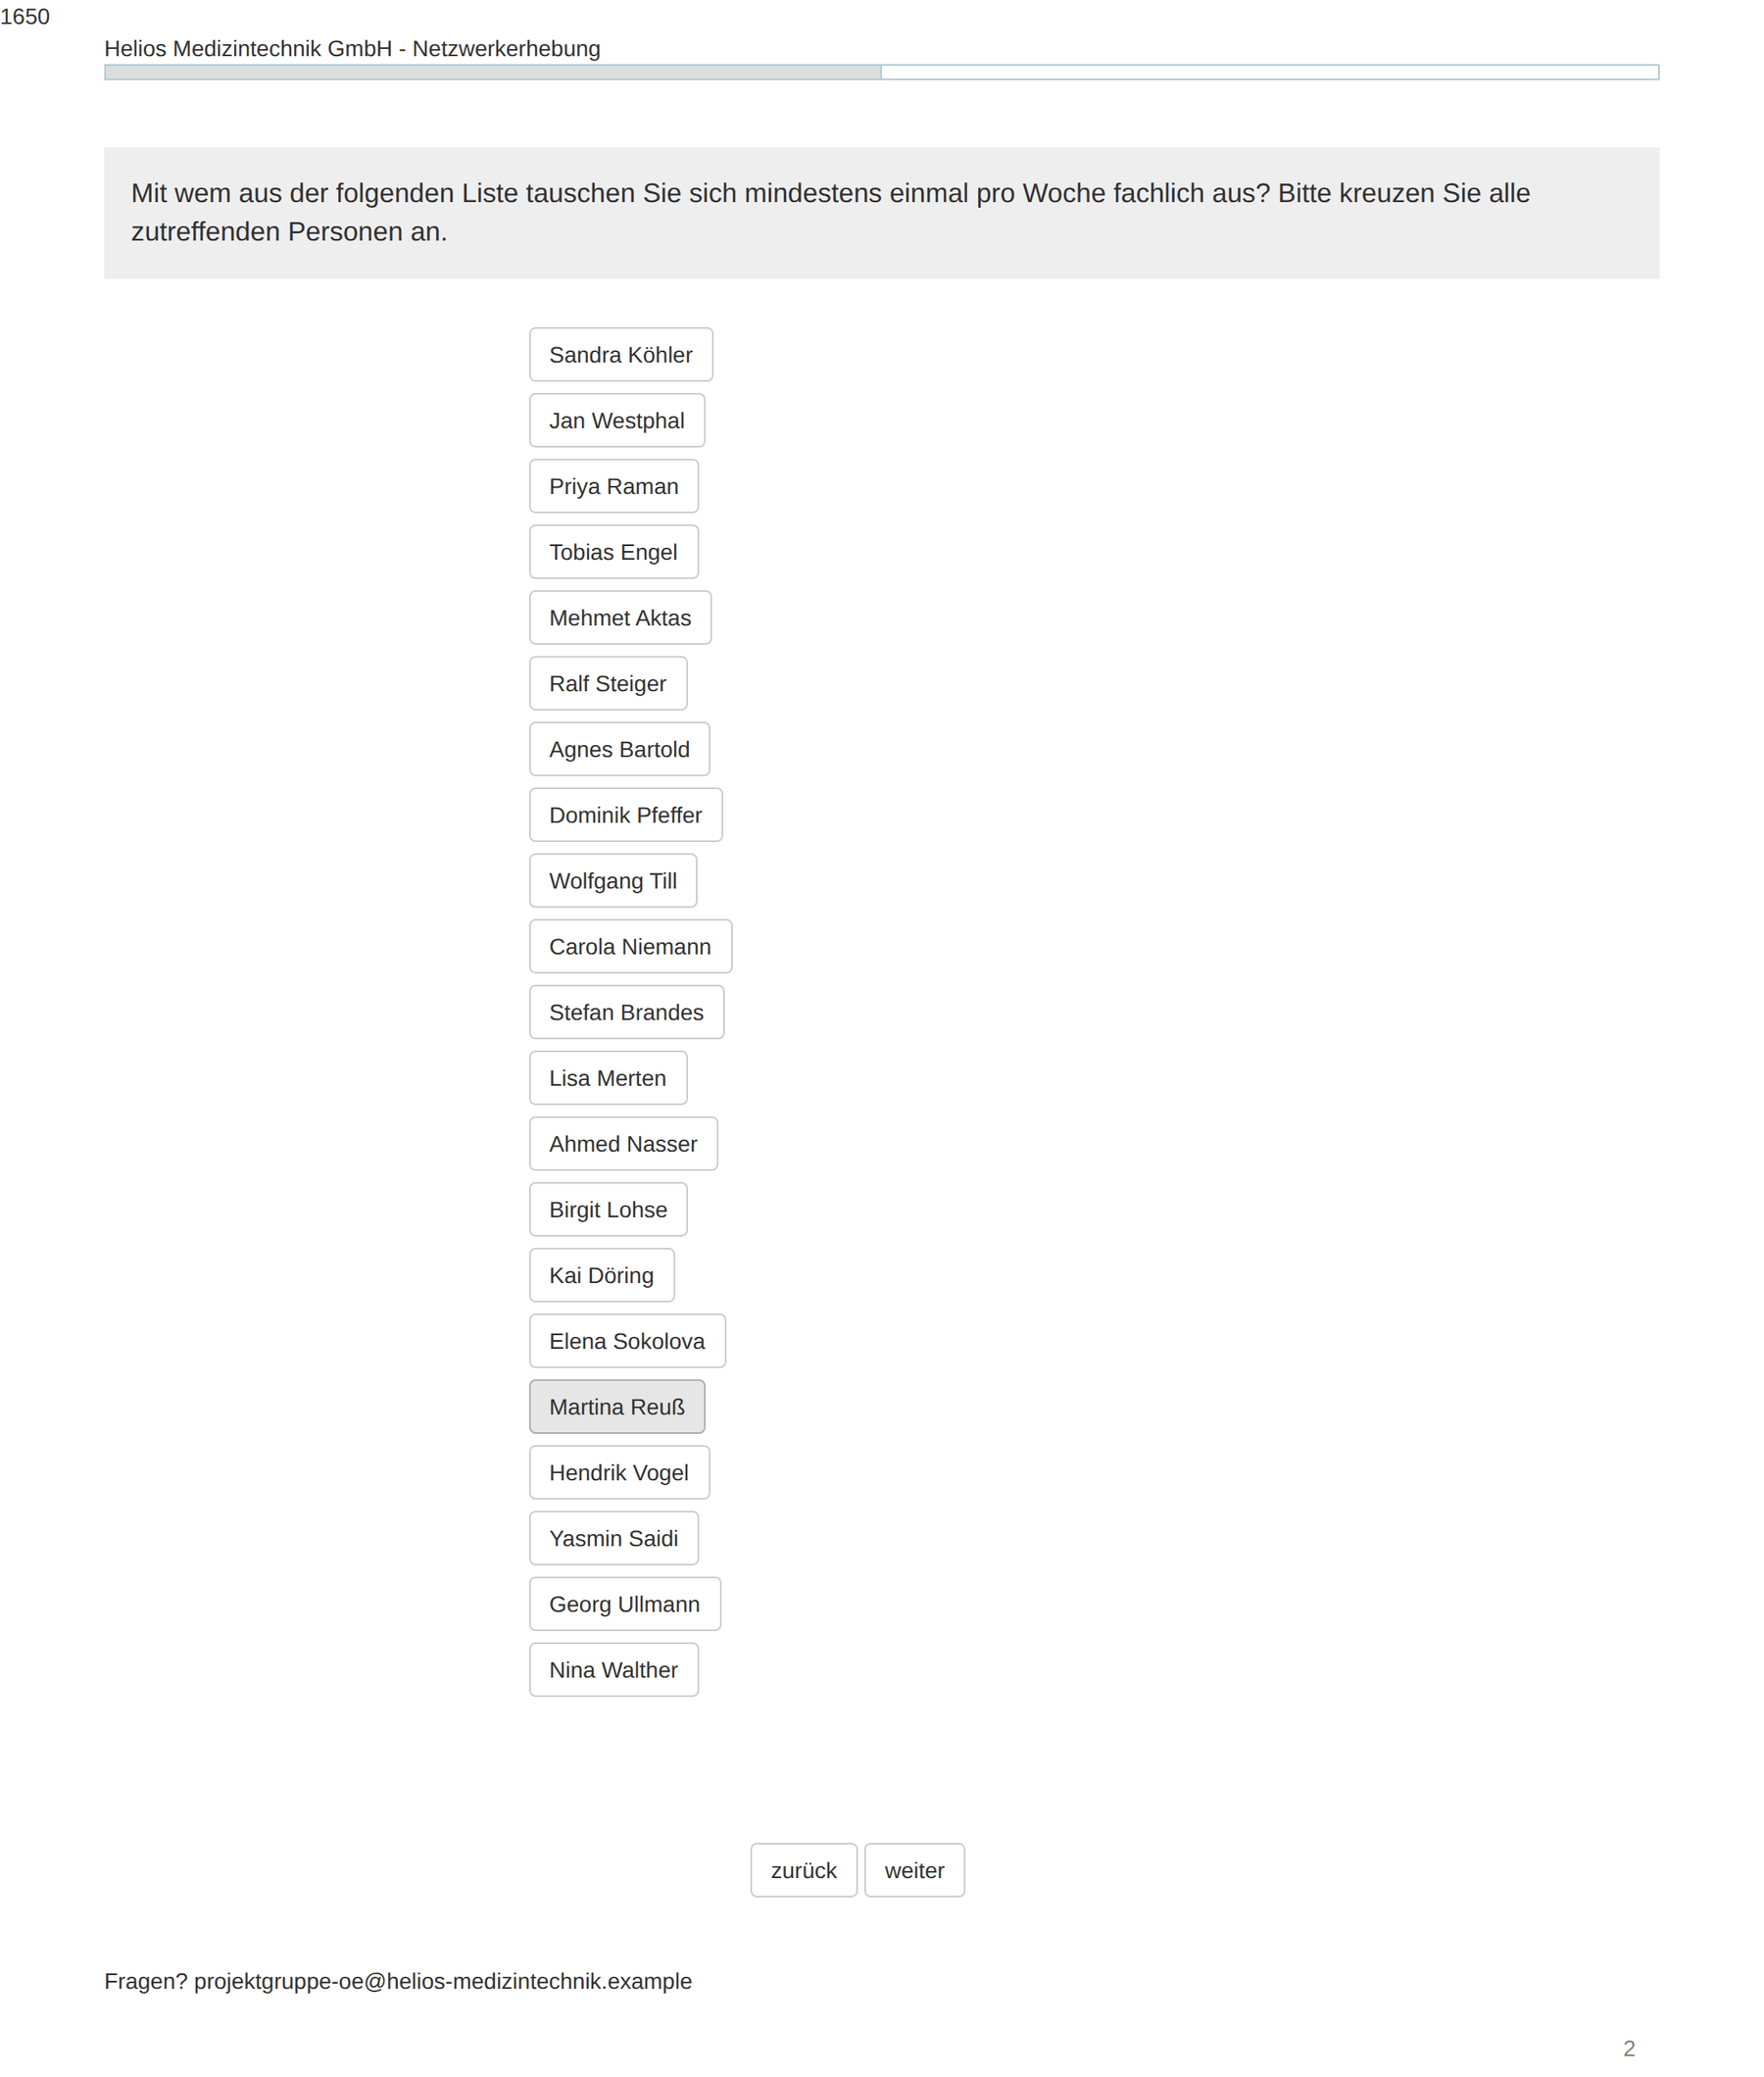
Why not free input? Because every typed mention creates a new actor. With 16 respondents naming four people each, around 80 actors would arise for 22 people – a data set from which no network can be computed. See also the corresponding warning in Online questionnaire.
Step 8: page 3 – contacts among themselves
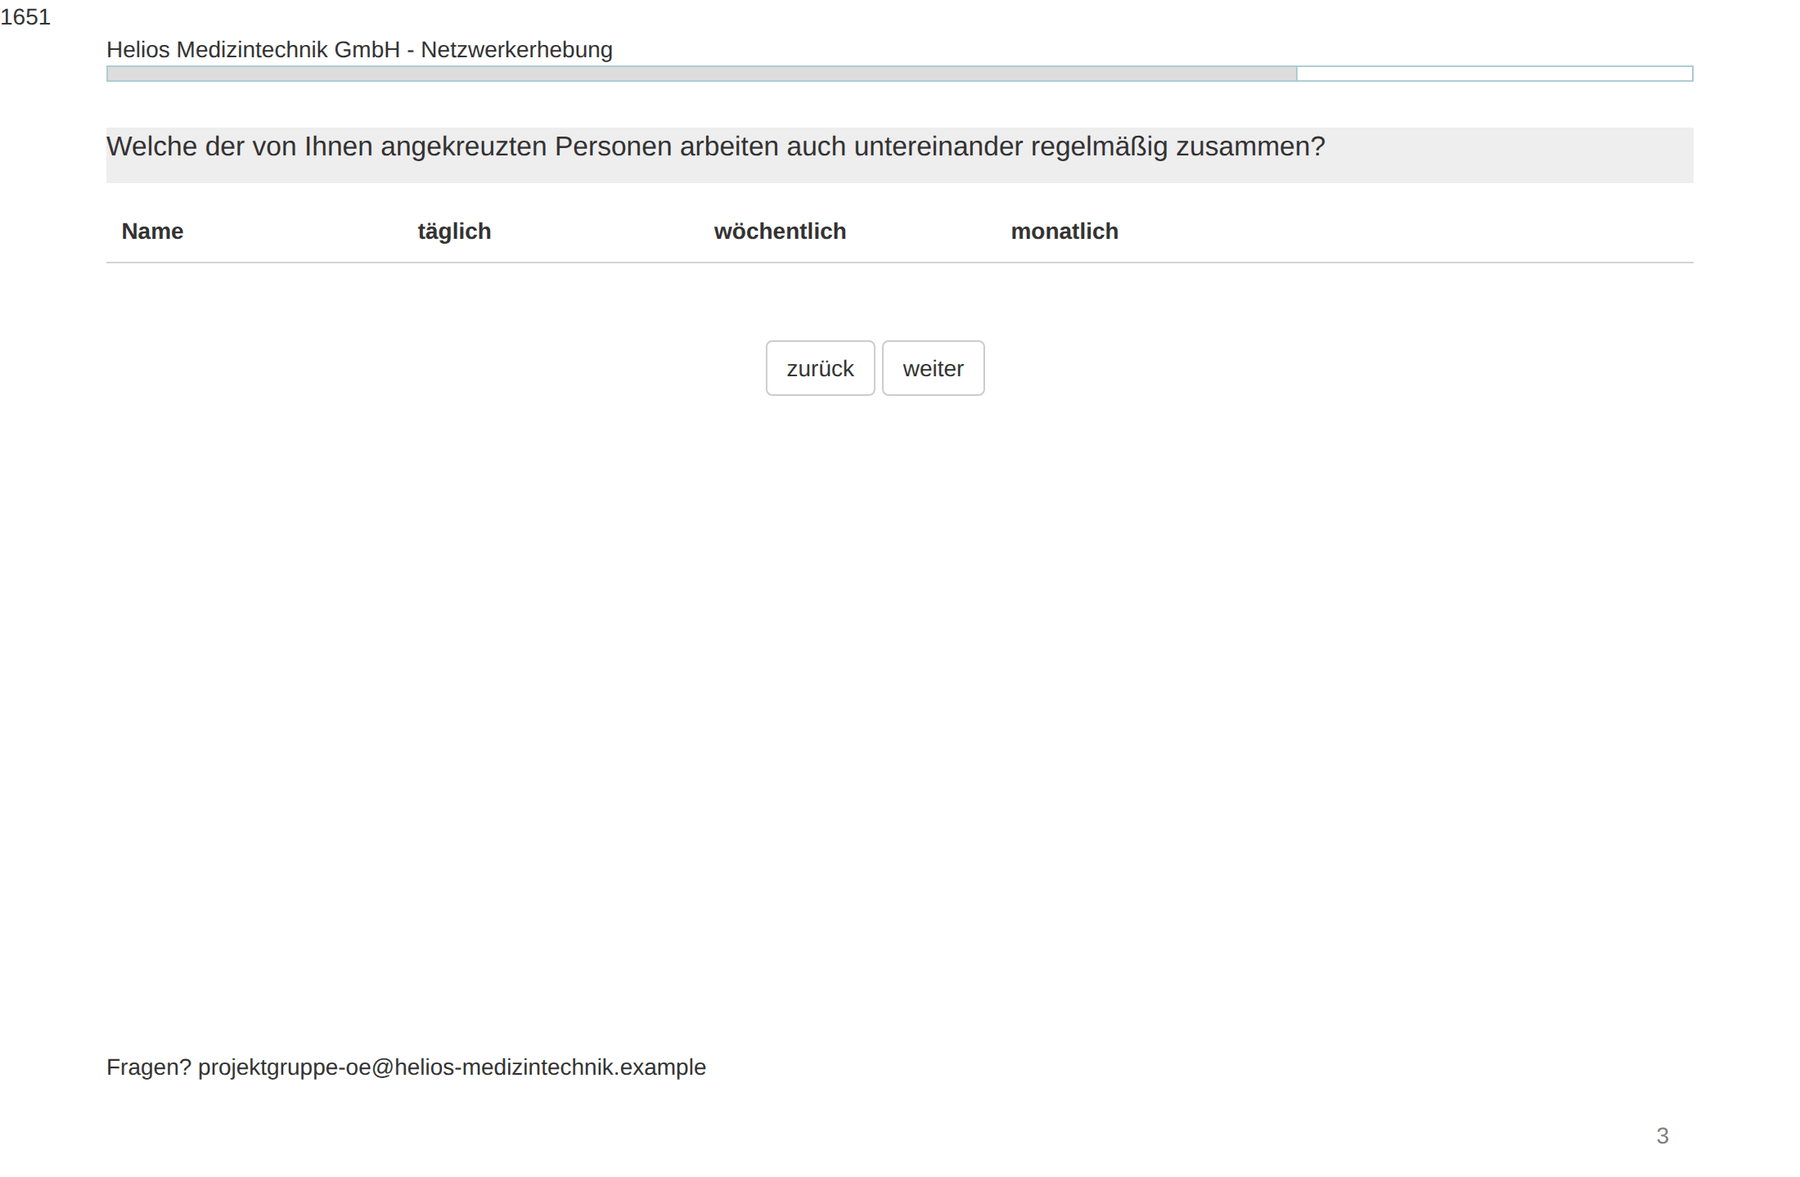
Add page → Kontakte untereinander → ⊕ → Alter-Alter relation: Group:
single_select: checkbox, with the same name attribute, relation attribute and
attribute value.
Important: switch the option question must be answered off here. With six people ticked there are fifteen pairs; as a required field respondents would have to state something for every single one.
Step 9: page 4 – thanks
Add page → Danke → ⊕ → Display a text with the closing text: when
and where the results will be presented.
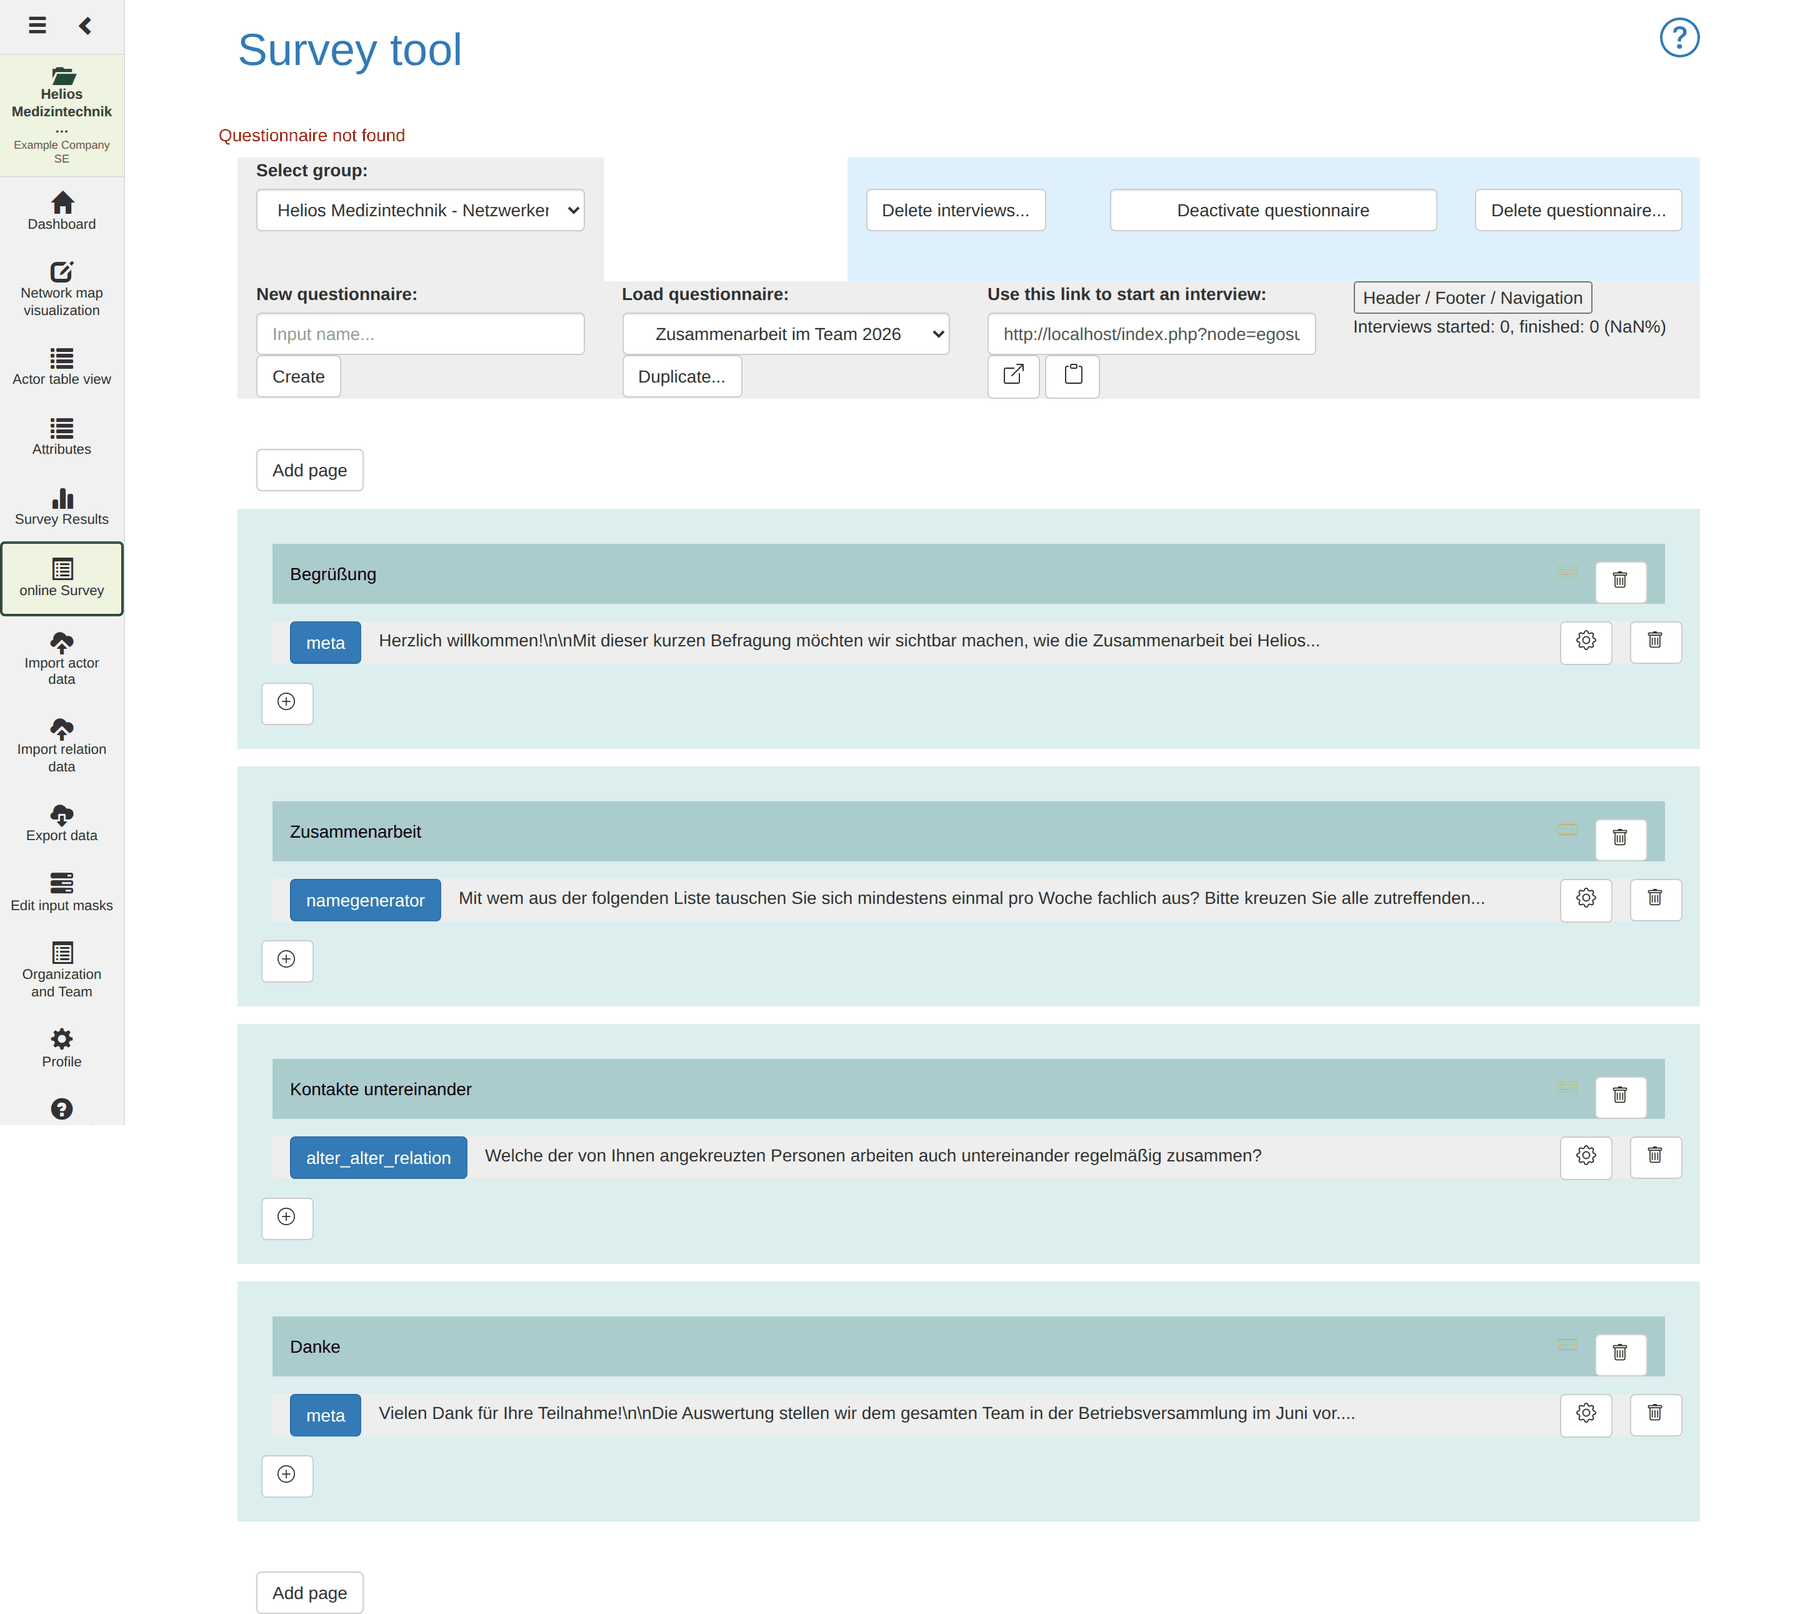
The finished structure:
Step 10: generate individual links
So that nobody has to type their name – and so that every answer is guaranteed to land on the right actor – each person gets their own link.
- Open the network map; if none exists, create one (with create necessary attributes automatically).
- In the side menu: Actors → add all actors.
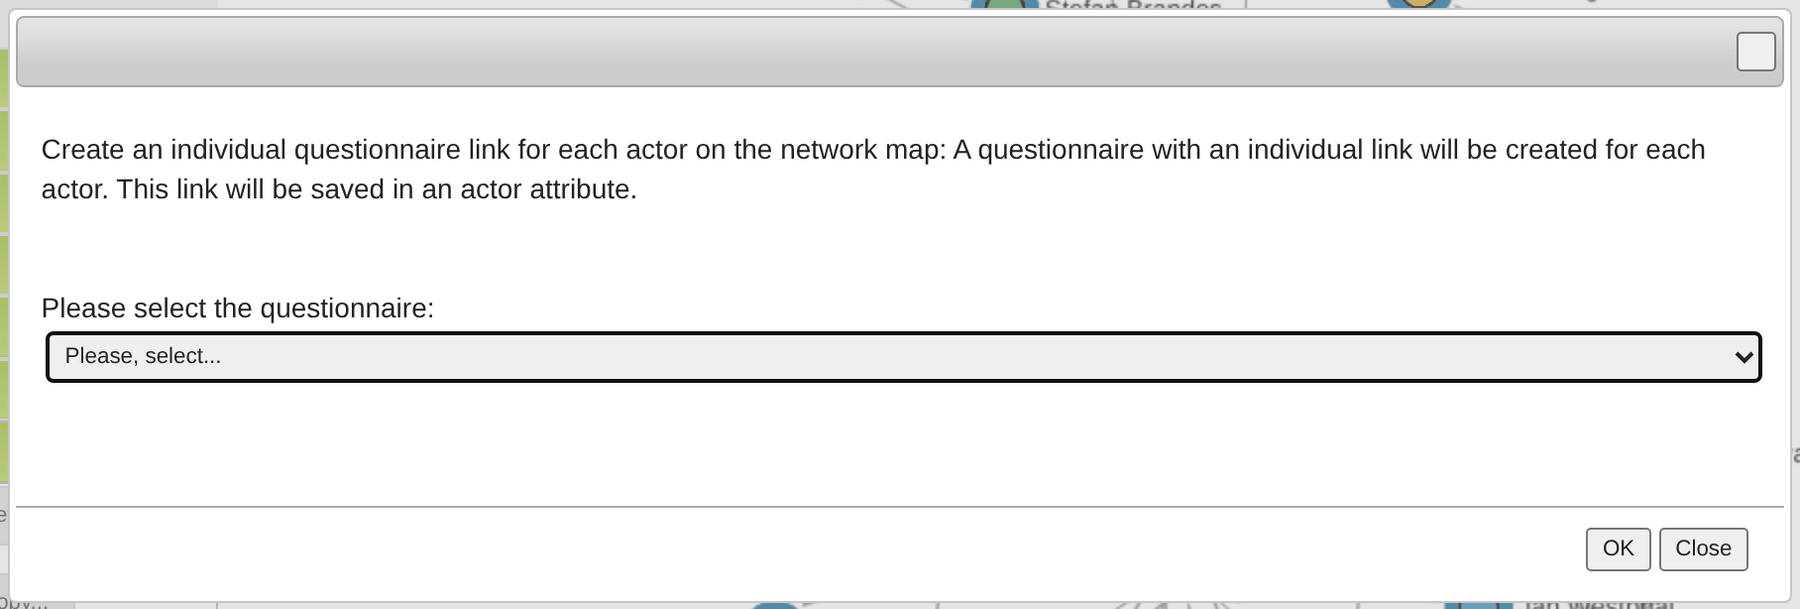
- Bulk action → Create an individual questionnaire link for every actor.
- Select the questionnaire and confirm.
The links are stored in the attribute
questionnaireLink_Zusammenarbeit im Team 2026. An export turns
that into a table of name, e-mail and link for a mail merge.
Mind the order: generate the links after the last time you used Delete interviews…. Deleting interviews invalidates existing individual links.
Step 11: test, then activate
Fill in the questionnaire once yourself, with a test actor created for the purpose. Check in particular whether the people ticked actually appear after the name generator. If it says No alteri named., the relation attribute or the attribute value does not match between the pages.
Then: delete the test interview, delete the test actor, regenerate the links, Activate questionnaire, send the links.
Part 4: interpreting the results
Of 22 employees, 16 answered – a response rate of 73 per cent. That yields 68 directed nominations between 42 pairs of people.
Step 12: building the map
- Network map → load the map
Arbeitsnetzwerk. - + Relation →
Arbeitskontakt, directed → Save. - + Relation →
Arbeitskontakt, reciprocal → Save. - Actors → add all actors.
- Actor symbol colour →
Abteilung, one colour per department. - Actor sector →
Geschlecht, one colour per value. - Analysis → layout: Kamada Kawai, scaling 12 → start.
- Analysis → centrality measures: compute now.
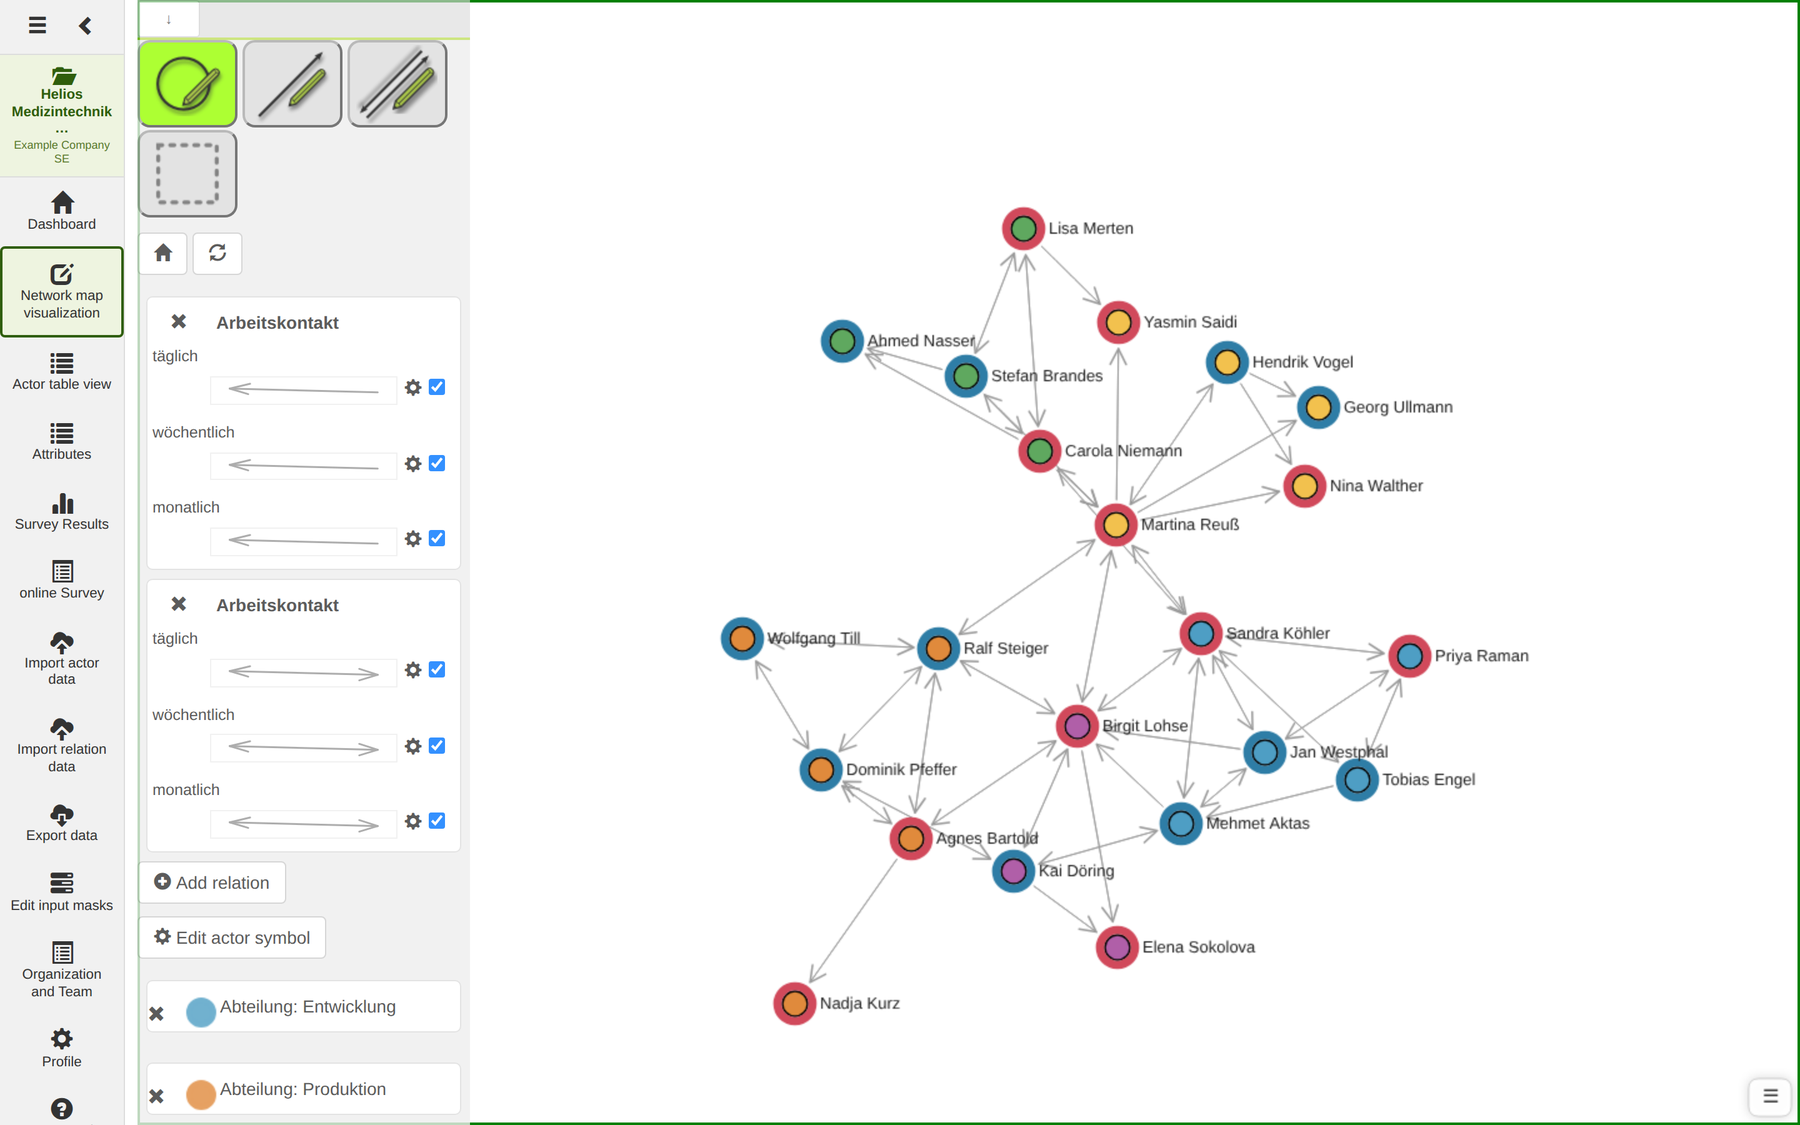
What the map shows
The departments form recognisable colour clusters – so collaboration largely follows the formal structure. Two things stand out beyond that:
- Between several departments direct connections are missing altogether, and between development and sales there is exactly one.
- Two nodes do not sit in their colour cluster but between the clusters: Martina Reuß (administration) and Birgit Lohse (quality assurance).
The measures
After compute now the values are available as attributes. Show them as columns in the actor table and sort by betweenness:
| Person | Department | In-degree | Out-degree | Betweenness | Betw. norm. | Closeness |
|---|---|---|---|---|---|---|
| Martina Reuß | Administration | 6 | 8 | 145.8 | 0.347 | 0.446 |
| Birgit Lohse | Quality assurance | 7 | 6 | 79.0 | 0.188 | 0.446 |
| Sandra Köhler | Development | 7 | 6 | 77.3 | 0.184 | 0.429 |
| Carola Niemann | Sales | 3 | 5 | 53.8 | 0.128 | 0.306 |
| Ralf Steiger | Production | 5 | 5 | 51.6 | 0.123 | 0.383 |
| Agnes Bartold | Production | 3 | 4 | 16.9 | 0.040 | 0.315 |
| Mehmet Aktas | Development | 4 | 4 | 13.0 | 0.031 | 0.335 |
| … | ||||||
| Wolfgang Till | Production | 2 | 2 | 0.0 | 0.000 | 0.268 |
Density of the network: 0.147 – about 15 per cent of all possible connections actually exist. For an organisation of this size that is a normal, rather middling value.
Finding 1: administration holds the place together
Martina Reuß has by far the highest betweenness at 145.8 – almost twice that of the next person. Normalised, 0.347 means she lies on nearly 35 per cent of all shortest paths between any two employees.
Her in-degree (6) is not the highest. That is exactly what makes the finding interesting: she is not the most popular person but the most indispensable one. She sits at the only place where departmental boundaries are regularly crossed.
What that means in practice: if Martina Reuß drops out – holiday, illness, resignation – the organisation does not lose one worker but its most important point of translation. That is a concrete, nameable risk, backed by a number rather than a gut feeling.
Finding 2: development and sales hang on a single connection
Management's original suspicion is confirmed – and becomes more precise. Counting the connections between each pair of departments gives this picture:
| Development | Production | Sales | Quality assurance | |
|---|---|---|---|---|
| Production | 0 | – | ||
| Sales | 1 | 0 | – | |
| Quality assurance | 4 | 3 | 0 | – |
| Administration | 1 | 1 | 3 | 1 |
Between the five people in development and the four in sales there is exactly one direct connection: Carola Niemann and Sandra Köhler. Between development and production, and between production and sales, there is none at all.
That explains the late project failures better than any assignment of blame: customer requirements hang on a single connection between two people. If either of them drops out, the whole exchange between sales and development runs through Martina Reuß – a detour at which information is lost.
The obvious measure is not “more meetings” but a second, independent connection: a fixed contact person from sales in the development round – and a repeat measurement in six months to see whether it holds. A single bridge is not a structure but a risk.
Finding 3: Birgit Lohse's high closeness
Birgit Lohse (quality assurance) reaches the same closeness value as Martina Reuß, 0.446 – she reaches everybody else over short paths. For a quality function that is exactly the right position: she has to be able to inform quickly in every direction.
Finding 4: what the zeros mean – and what they do not
Six people have an out-degree of 0: Ahmed Nasser, Elena Sokolova, Yasmin Saidi, Georg Ullmann, Nina Walther and Nadja Kurz.
This is the most important misreading one can make here. These six are not unconnected – they are the six who did not answer. Their nominations are simply missing. That they nevertheless have an in-degree between 1 and 2 shows that others do name them.
An out-degree of 0 in a whole-network study is almost always a non-response, not a finding about the person. Always check this against the participant list before interpreting.
Wolfgang Till and Hendrik Vogel, by contrast, are genuine findings: both answered and still have a betweenness of 0 – they lie on not a single shortest path between two other people. Wolfgang Till names two people and is named by two; he is embedded inside production but not beyond it.
That their closeness, at 0.268 and 0.282, is not the lowest in the network – Stefan Brandes and Lisa Merten from sales are below them at 0.223 each – shows the difference between the two measures: closeness measures how far somebody is from everybody else, betweenness whether they matter to anybody. Sales as a group sits far from the rest; Wolfgang Till sits closer but contributes nothing to holding things together.
Limits of this analysis
| Limitation | Consequence for the interpretation |
|---|---|
| 73 % response | In-degrees are robust, out-degrees only for the 16 respondents |
| One kind of relation only | The survey says nothing about trust or conflict |
| A snapshot | No statement about development; that needs a second wave |
| Self-report | Recall and social desirability play a part |
Step 13: reporting back
Network surveys create an obligation. Whoever surveys employees owes them feedback – and feedback that exposes nobody.
Suitable for reporting back:
- The map with departments instead of names as the label
- Density and response rate
- The statement about the missing connection between two departments
- The measures planned
Not suitable:
- Rankings of individuals
- The map with real names in front of the assembled staff
- Any statement of the form “X is named by nobody”
Tip: for the presentation, duplicate the map (Management → duplicate current network map) and switch the actor label to
Abteilungin the copy. The original with names stays with the working group.
Summary of the procedure
| Step | Module | Result |
|---|---|---|
| 1 | Project | Workspace created |
| 2 | Attributes | Abteilung, Arbeitskontakt and so on defined |
| 3 | Import | 22 employees as actors |
| 4 | Organisation | Proxy user checked |
| 5–9 | Questionnaire | Four pages, a roster instead of free input |
| 10 | Network map | An individual link per person |
| 11 | Questionnaire | Tested, activated, sent |
| 12 | Network map | Map, layout, centrality measures |
| 13 | Export | Image and data for report and feedback |