Survey results
The Survey statistics module shows what a survey has produced: how many interviews were started and completed, which answers were given, and how the recorded actors hang together. From here you take the data onto a network map or download it.
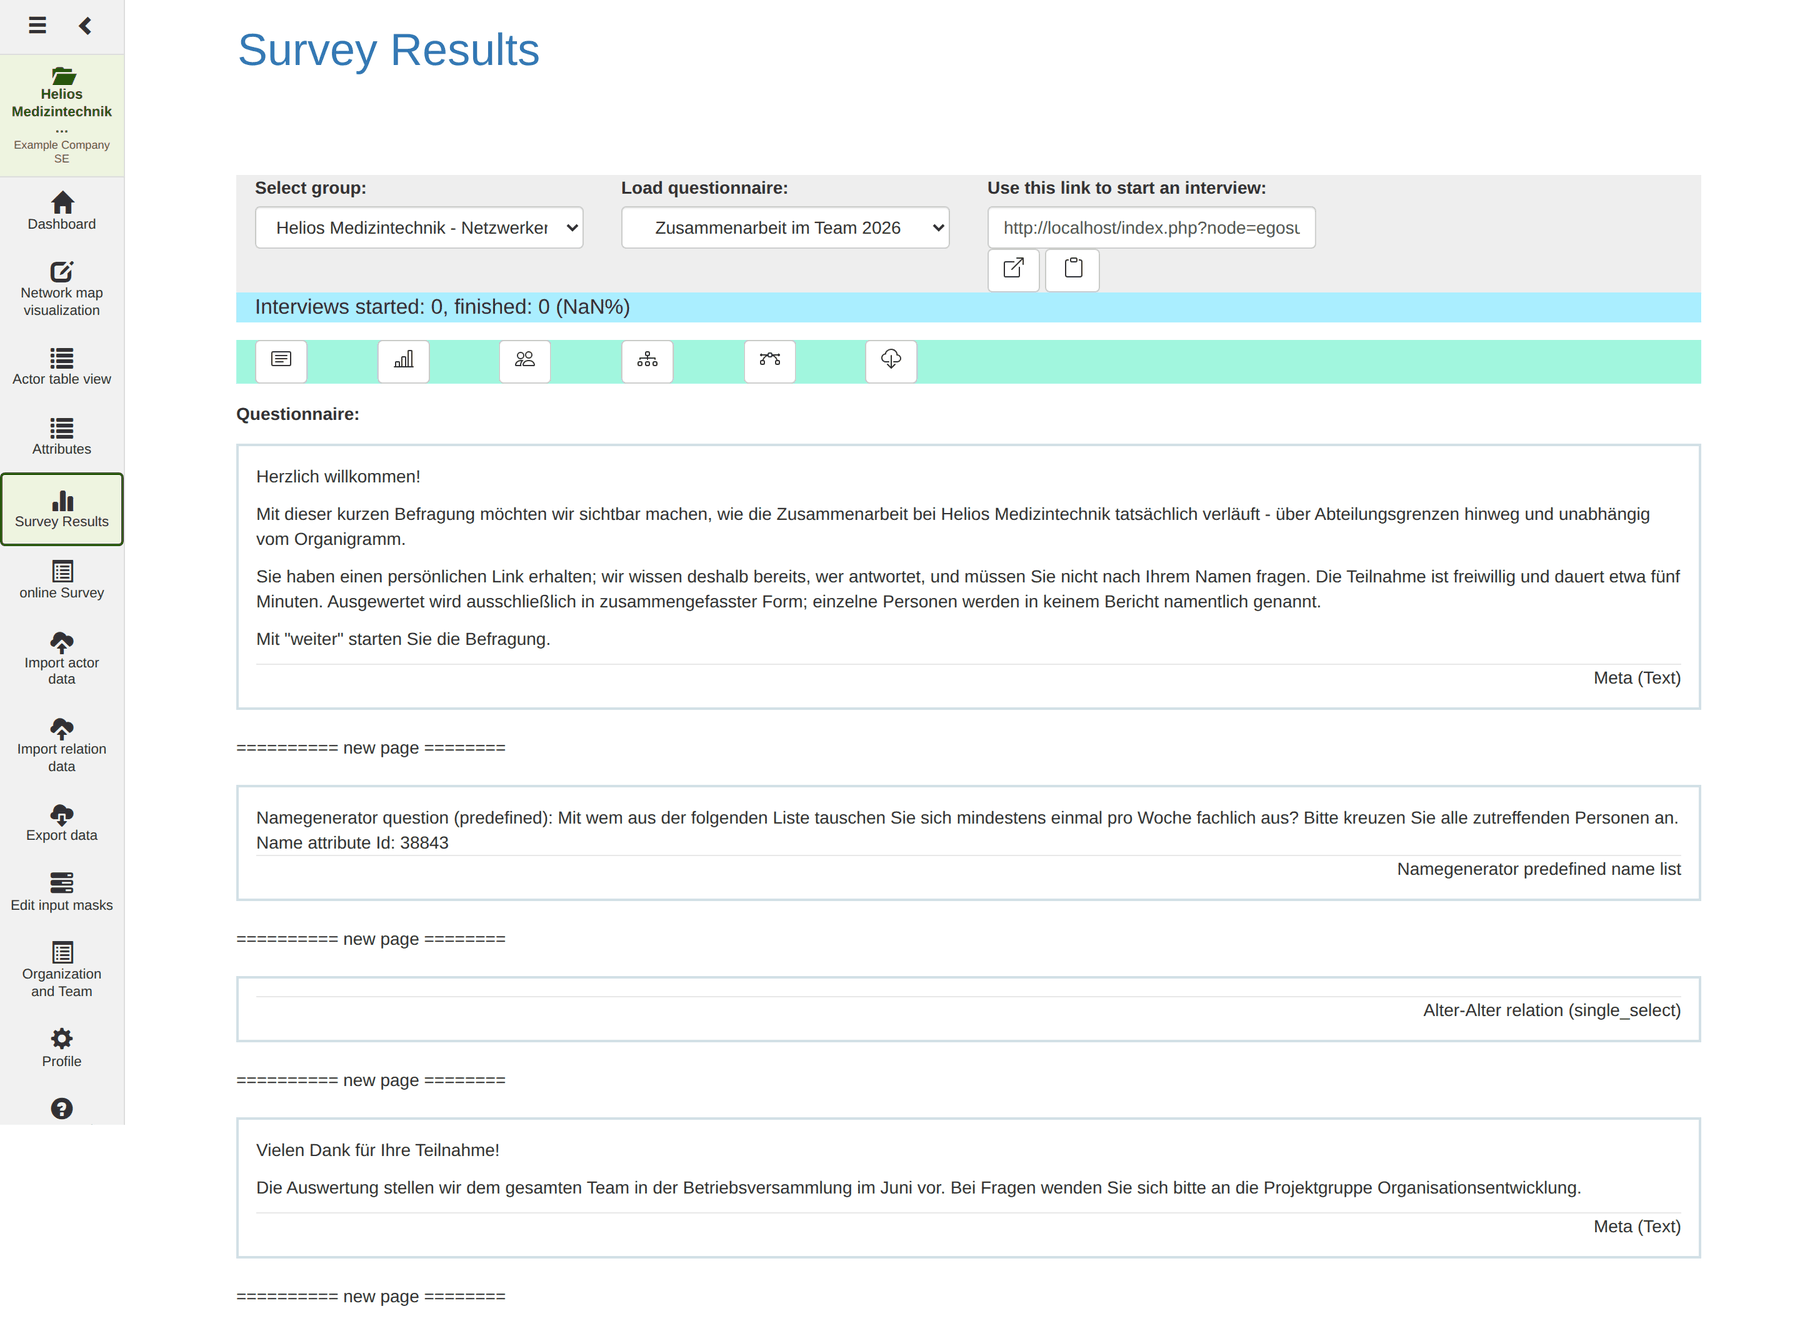
A note on language: this module too is labelled entirely in English.
Note: the questionnaires shown are those of the active project.
Choosing a questionnaire
At the top you choose the rights group under Select group and the questionnaire under Load questionnaire. Next to it is the general participation link with two icons: one opens a new interview, the other copies the link to the clipboard.
If the project has no questionnaire yet, the module reports No questionnaire found.
The response display
The blue bar states the two most important numbers of the running survey:
Interviews started: 18, finished: 16 (88%)
| Figure | Meaning |
|---|---|
| started | How often an interview was opened |
| finished | How many interviews were taken to the last page |
| Percentage | Share of completed among started interviews |
This percentage is not the response rate. It relates completed interviews to started ones, not to the size of the population. The response rate proper you work out yourself: completed interviews divided by the number of people invited. In use case 1 that is 16 out of 22 – 73 per cent.
A large gap between started and finished is a warning sign. It means people are dropping out. The commonest causes: an alter-alter question with too many pairs, a required question nobody can answer, or simply a questionnaire that is too long.
The toolbar
Six buttons lead to the different views.
| Symbol | Function | What it shows |
|---|---|---|
| Document | Show the questionnaire elements | The questionnaire page by page, with question texts and element types |
| Bar chart | Show some survey statistics | Analyses of the answers given |
| People | Show interviews of the current questionnaire | The individual interviews and their state |
| Network diagram | Add actors to network map visualization | Takes the recorded actors onto a network map |
| Connecting lines | Alteri actor data to ego-alter relation transformation | Converts statements about alteri into ego-alter relations |
| Download | Download survey data | Opens the export dialog |
Showing the questionnaire elements
The default view lists the questionnaire in the order respondents see it: per page the elements it contains, with the full question text, the element type and – for name generators – the id of the name attribute used.
Useful for documenting a survey. This view is the complete, readable version of the instrument – exactly what belongs in the methods section of a report.
Statistics
Shows the distribution of the answers given, per question across all interviews. This is a quick check of whether a question was understood at all: an option nobody chose is either superfluous or ambiguously worded.
Interviews
Lists the individual interviews with their state. Here you see who started and did not finish – and, with individual links, which actor an interview belongs to.
Caution: this view is personal data. It belongs in the hands of the survey team, not in a presentation.
Taking actors onto the network map
Transfers the actors created by the questionnaire onto a network map. This is the direct route from survey to picture – the alternative to Actors → add all actors on the map itself.
Converting alteri data into relations
Some statements are recorded in the interview as a property of an alter but really belong to the relation between ego and that alter – “how often do you see this person?”, for instance. This function rewrites such statements into a relation attribute.
When you need it: when you used a name interpreter while building the questionnaire where an EgoAlter element would have been right. The distinction is described in Online questionnaire. The conversion repairs it afterwards, without repeating the survey.
Downloading the data
The Export survey data dialog offers two formats:
| Button | Format | What for |
|---|---|---|
| Get the survey data results as a file (CSV format) | CSV | Spreadsheet, SPSS, R |
| Get the survey data results as a file (GRAPHML format) | GraphML | Gephi, yEd, Visone |
Note: this export delivers the survey data – what was answered in the interviews. The project's whole stock of actors and relations including the computed measures is fetched through the Export module.
A typical sequence after a survey
- Check the response – is participation sufficient for an interpretation?
- Look at the statistics – were all questions understood?
- Go through the interviews – are there conspicuously many drop-outs at one particular point?
- Take the actors onto the network map.
- There set up the relations, run a layout, compute the centrality measures.
- Fetch the data for the report through Export.