Ego network map
The ego network map draws a network from one person's point of view. That person – the ego – sits in the middle, and around them are the people, organisations and groups that belong to their network. How close someone stands and which part of life they belong to is not stated in a form: you say it by placing them on the map.
That is the pleasant part: the drawing area collects the data itself. Drag someone one ring further in and their attribute value changes with them. An interview can be drawn while you talk, and what you end up with is a table ready for analysis – without anyone filling in a questionnaire.
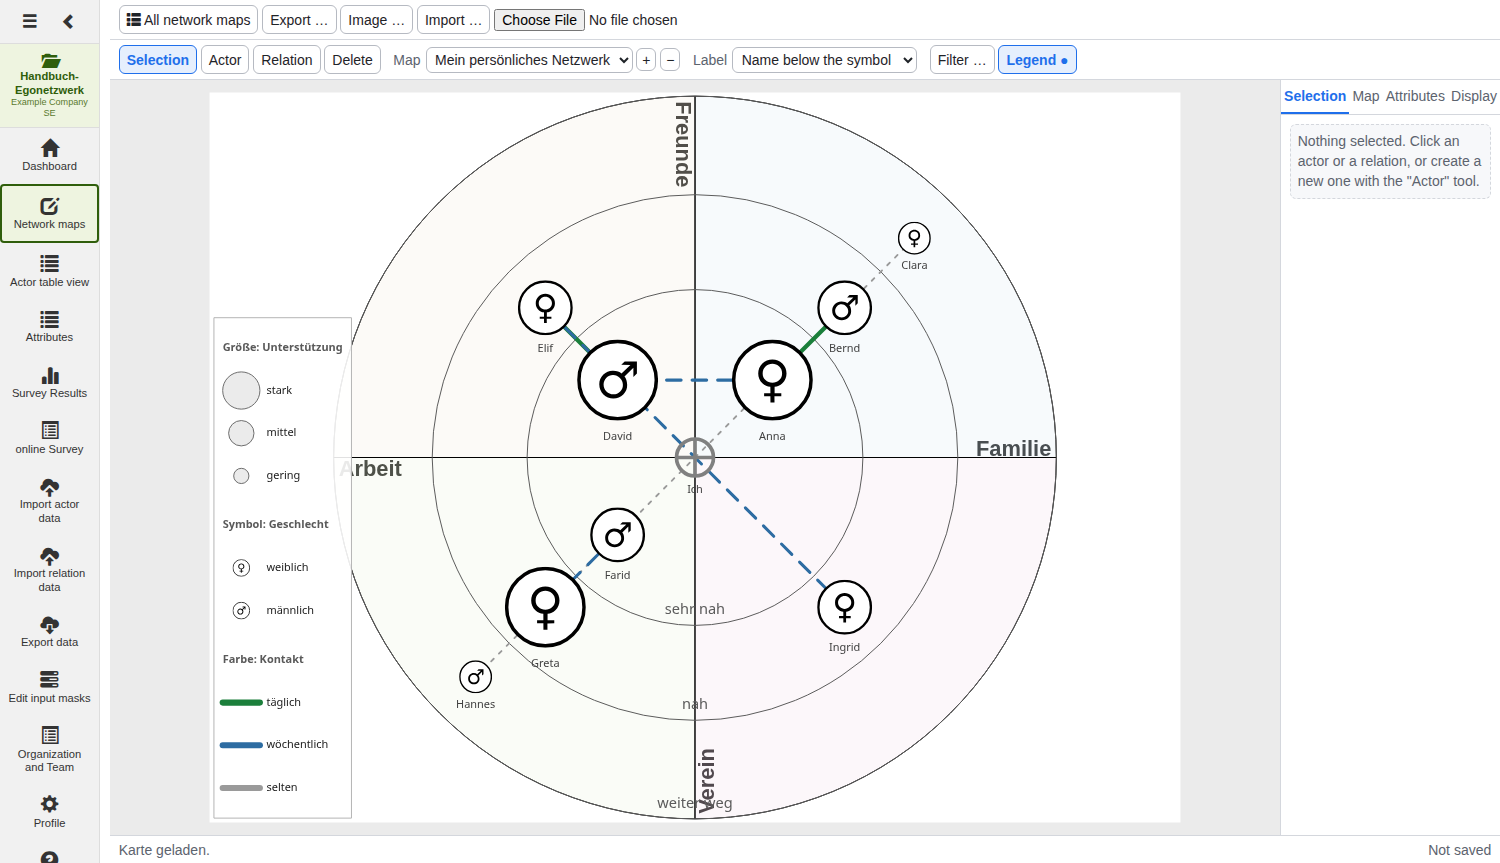
Ego maps are created and opened from the network map overview.
Note: any role may look at a map. Drawing, moving and styling need at least Survey, new attribute types the role Editor – see roles in the project.
Page layout
| Area | Function |
|---|---|
| Header (top) | Back to the overview, export, image, import |
| Toolbar | Tools, map selection, label, filter, legend |
| Drawing area | The map itself |
| Properties panel (right) | Four tabs: Selection, Map, Attributes, Display |
| Status line (bottom) | Feedback on the last action |
Everything is saved immediately. There is no save button and no undo: every action goes to the server the moment you perform it. The words Not saved at the bottom right of the status line are a display error and say nothing about your data.
The header

| Button | What for |
|---|---|
| All network maps | Back to the overview |
| Export … | The data as CSV tables or in Pajek format |
| Image … | The map as PNG, SVG or JPEG |
| Import … | Read in a .venn or .vmt file from VennMaker |
The toolbar

The four tools
| Tool | Key | What it does |
|---|---|---|
| Selection | V |
Click actors and move them |
| Actor | A |
Clicking the map creates an actor; dragging moves an existing one |
| Relation | R |
Dragging from one actor to another draws a relation |
| Delete | E |
Clicking an actor or a relation removes it |
The keys work as long as the cursor is not inside an input field. Del or
Backspace removes the actor currently selected.
Map, label, filter, legend
| Element | What for |
|---|---|
| Map (drop-down) | Switch between the ego maps of the project |
| + | Create another ego map – you are asked for a name |
| − | Delete the open map |
| Label | How the name sits at the symbol – six options, see below |
| Filter … | Highlight actors by attribute value |
| Legend … | Show or hide the legend |
The label choices are: Name below the symbol, Name on the symbol, Name to the right, Name to the left, Number instead of name and No label. The last two are useful when you want to show or publish a map without giving names away.
The last map cannot be deleted. A project always keeps at least one ego map. Deleting loses the positions and the relations of that map – the actors themselves stay with the project.
Putting actors on the map
Pick the Actor tool and click where the person should stand. They get a provisional name, which you change in the properties panel or through the context menu.
With the Selection tool you can move any actor anywhere. And this is where the special thing happens:
Position writes attribute values. If an actor stands in a circle or a sector that has an attribute assigned to it, they take on its value – automatically and at once. Drag them into another ring and the value changes with them. Move them out of the circles altogether and the value is cleared.
The context menu
A right-click opens a different menu depending on the target:
| Right-click on | Entries |
|---|---|
| an actor | Edit "name", Rename …, Delete |
| the ego | additionally Centre – brings it back to the middle |
| a relation line | Edit the relation, Delete |
| empty space | Create an actor here, Map settings |
The ego cannot be deleted, but it can be moved. If you have dragged it out of the middle by accident, Centre in the context menu puts it back exactly.
Drawing relations
Relations in MyNetworkmap are always attribute values between two actors – there is no line without a value. Which kind of relation you are drawing is chosen in the relation bar, which appears as soon as you activate the Relation tool.

On the left – if there is more than one – sits the relation attribute, and next to it one button per value with a small preview of its line. Click a value and then drag from one actor to another.
The Line … button on the right sets the colour, width and shape of exactly that value.
Note: if you draw with a relation type that shows no lines on this map yet, it is switched on automatically. Otherwise you would have drawn something and seen nothing.
No relation attribute yet? Then the bar says "No relation attribute with a value list". Create one in the Attributes tab – with a value list, for instance daily · weekly · rarely.
The properties panel
To the right of the map there are four tabs. They are the control room of the map.
Tab Selection
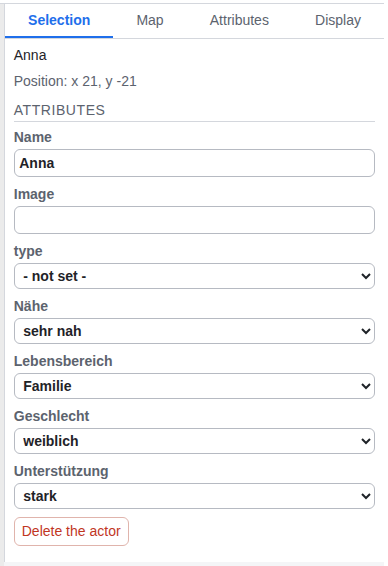
Shows whatever you have just clicked. For an actor it lists their position and every actor attribute as an input – drop-downs for attributes with a value list, text fields for free text. Below sits Delete the actor.
For a relation it shows source and target plus the relation attributes. The attribute of the line you clicked is highlighted: Delete the relation removes exactly that line, not the others between the same two actors.
The name is an attribute value. That is why there is no separate name field here – the name sits in the attribute list, at whichever attribute is chosen as the name attribute in the Attributes tab.
Tab Map
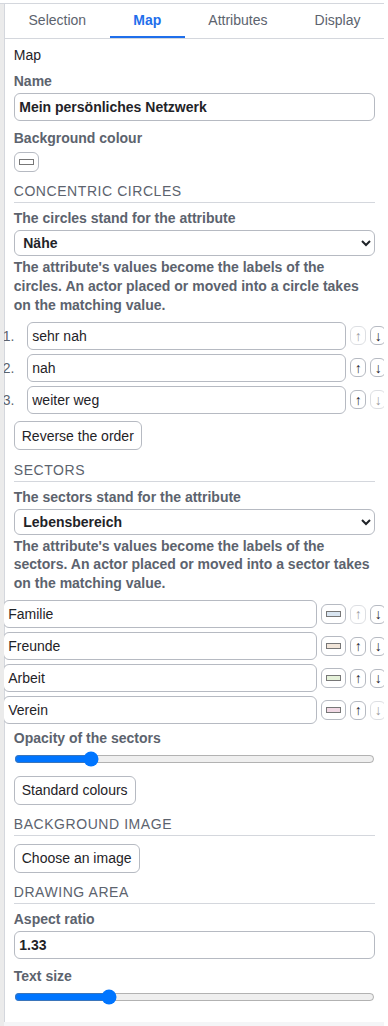
This is where you set up the surface you draw on.
| Setting | What for |
|---|---|
| Name | The name of this map, as it reads in the overview |
| Background colour | Colour of the drawing area |
Concentric circles. Under The circles stand for the attribute choose an actor attribute with a value list – typically closeness. The values become the labels of the rings, from the inside out. Below that you can edit the labels and reorder them with ↑ ↓; Reverse the order swaps inside and outside.
The number of rings is the length of the value list. There is no separate field for it, and that is deliberate: a ring without a matching value could not give an actor one. You get more rings by adding a value to the attribute.
Sectors. The same for the pie slices: an attribute with a value list – the part of life, say – decides how many there are and what they are called. Each sector takes a colour, Standard colours resets them all, and Opacity of the sectors controls how strongly they sit under the map.
Background image. Choose an image puts a graphic under the map – a site plan or a sketch of an organisation chart, for example. Once one is set, Replace the image and Remove appear.
Drawing area. The aspect ratio (0.5 to 3) decides whether the area is wide or tall; the text size (50 to 250 %) scales every label on the map.
Tab Attributes
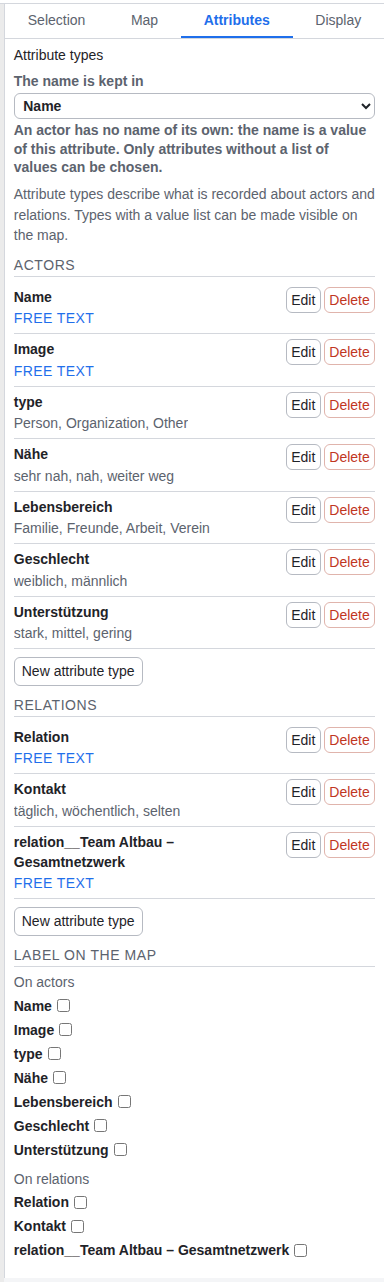
Attribute types describe what you record about actors and relations.
The name is kept in. An actor has no name of its own – the name is the value of an attribute, and here you say which one. Only attributes without a value list can be chosen: names do not belong in a value list, or every new name would become another entry in a drop-down for everyone.
Below that are the attribute types, split into Actors and Relations, each with Edit and Delete and a New attribute type button.
Creating one asks four things:
| Field | Meaning |
|---|---|
| Name | The label of the attribute |
| Validity | The same on every map or Different per map |
| Value list | One value per line. Leave it empty for a free-text attribute |
| Question (optional) | The wording you use to ask for the value in an interview |
Editing adds a default value.
Validity is the more consequential of the two decisions. The same on every map means: a person's gender is the same on every map. Different per map means: the closeness of the same person may differ between the map "before the move" and the map "today". Such attributes are marked per map in the list.
At the bottom, Label on the map decides which attribute values are printed next to actors and next to relations – one tick per attribute.
Attribute types belong to the project, not to the map. The list therefore also shows the technical attributes a complete network map has created (
relation__…). Leave them alone – the other map needs them.
Tab Display
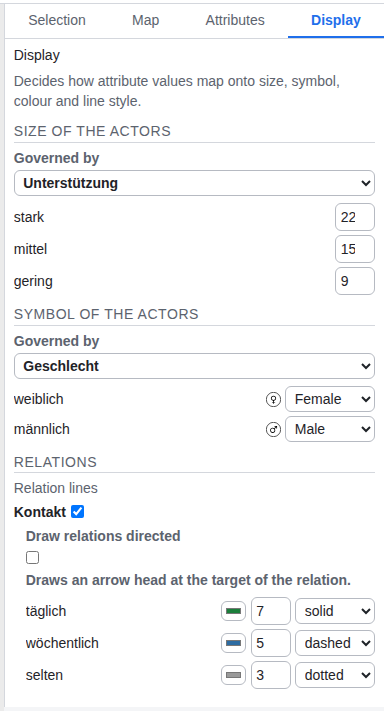
This is where values become a picture. Every setting follows the same pattern: at the top you pick an attribute with a value list under Governed by, and below it one row per value appears.
| Section | What can be set |
|---|---|
| Size of the actors | A number from 2 to 40 per value |
| Symbol of the actors | One of 18 supplied symbols per value – circles, figures, buildings, patterns |
| Relations | Which relation attributes draw lines at all |
Under Relations you tick one box per attribute – several may draw at once. For each ticked attribute you get:
- Draw relations directed – with an arrow head at the target
- one row per value with colour, width (1 to 40) and line style (solid, dashed, dotted)
If relations seem to be missing: when an attribute draws no lines, the relations are not deleted – they are merely invisible. The list then notes how many relations are currently hidden.
Filtering actors
Filter … in the toolbar highlights actors by their attribute values.
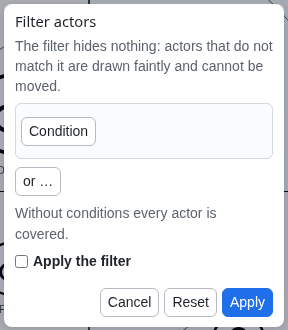
You assemble conditions: attribute, comparison, value. Conditions inside a group must all hold (and), between groups one is enough (or). A line below the conditions shows continuously how many actors the filter currently covers.
Apply the filter switches it on, Reset throws all conditions away. While a filter is active the button carries a dot: Filter ●
Note: the comparison operators are shown in German even when the rest of the interface is English – gleich (equal to), ungleich (not equal to), kleiner als (less than), kleiner oder gleich (less than or equal), größer als (greater than), größer oder gleich (greater than or equal).
The filter hides nothing. Actors that do not match are drawn faintly and can no longer be moved. They stay visible and in context – when you are showing and discussing a map, that is usually more useful than hiding them.
The legend
Legend … places an explanation of the colours, sizes and symbols in use at the bottom left of the map.
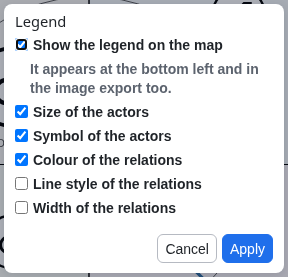
| Switch | Shows |
|---|---|
| Show the legend on the map | The legend at all |
| Size of the actors | Which value means which size |
| Symbol of the actors | Which value means which symbol |
| Colour of the relations | Which value means which colour |
| Line style of the relations | Solid, dashed, dotted |
| Width of the relations | Which value is drawn how thick |
The legend appears in the image export too – it belongs to the map, not just to the view.
Exporting data
Export … in the header hands the map out as a dataset.
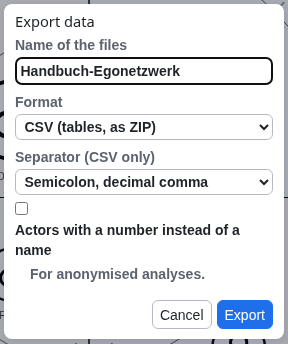
| Field | Choice |
|---|---|
| Name of the files | Pre-filled with the project name |
| Format | CSV (tables, as ZIP), Pajek (.net per map) or Both |
| Separator (CSV only) | Semicolon, decimal comma or Comma, decimal point |
| Actors with a number instead of a name | For anonymised analyses |
Tip: semicolon with decimal comma is the setting that lets Excel in a German locale open the file without asking. For R, Python or pandas, comma with a decimal point is usually more convenient.
The map as an image
Image … produces an image file of the map as it currently looks – including the legend and the chosen label style.
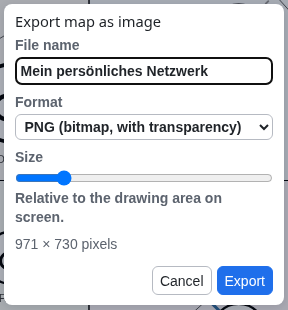
| Field | Choice |
|---|---|
| File name | Pre-filled with the map name |
| Format | PNG (with transparency), SVG (vector), JPEG (smaller) |
| Size | 20 to 500 %, relative to the drawing area on screen |
Below the slider the resulting pixel size is shown as you move it. For SVG the slider is disabled: a vector file scales to any size anyway.
For print choose SVG if the target software understands it, otherwise PNG at 200 to 300 %. An image at screen size looks coarse in print.
Importing from VennMaker
Import … reads .venn and .vmt files from VennMaker. The file is read on
the server; maps, actors, attributes and relations are created in the current
project, and the first imported map is opened afterwards.
Read the notes after an import. If the file comes from another VennMaker version it may carry fields this edition does not know, or attribute names that collide with existing ones. Whatever was not taken over is listed afterwards, point by point.
Keyboard shortcuts
| Key | Effect |
|---|---|
V |
Selection tool |
A |
Actor tool |
R |
Relation tool |
E |
Delete tool |
Del / Backspace |
Delete the selected actor |
An ego map from scratch: the short version
- In the overview click New ego network map and give it a name.
- Tab Attributes: create a free-text attribute for the name and choose it under The name is kept in.
- Create two attributes with value lists – one for closeness (very close · close · further away), one for the part of life (family · friends · work · club).
- Create a relation attribute with a value list, for instance contact (daily · weekly · rarely).
- Tab Map: assign those two attributes to the circles and the sectors.
- Actor tool: put the people where they belong. Closeness and part of life write themselves as you do.
- Relation tool: pick a value, drag from actor to actor.
- Tab Display: put size and symbol on attributes, set the colours of the relation lines.
- Switch the legend on, export with Image … – and hand the data out for analysis with Export ….